| Start Page |
|
 |
| Start Page |
|
|
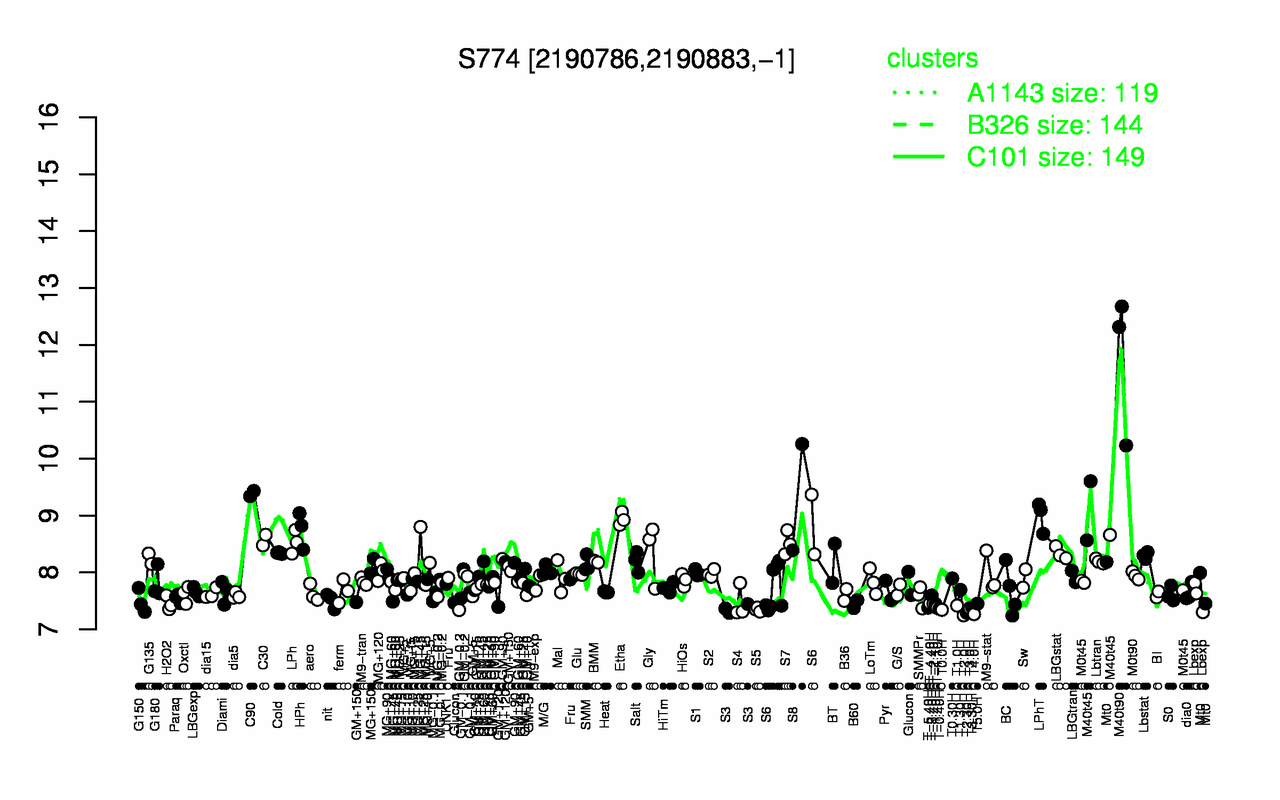
| M40t90 | C90 | S8 | LPhT | M40t45 | Etha | HPh | C30 | LPh | S7 |
| 11.7 | 9.39 | 9.32 | 8.99 | 8.94 | 8.94 | 8.75 | 8.57 | 8.54 | 8.52 |
| T2.0H | T4.0H | T2.30H | T0.0H | S5 | T-0.40H | S3 | T3.0H | T-1.10H | T-5.40H |
| 7.25 | 7.27 | 7.29 | 7.34 | 7.35 | 7.36 | 7.37 | 7.37 | 7.38 | 7.38 |