| Start Page |
|
 |
| Start Page |
|
|
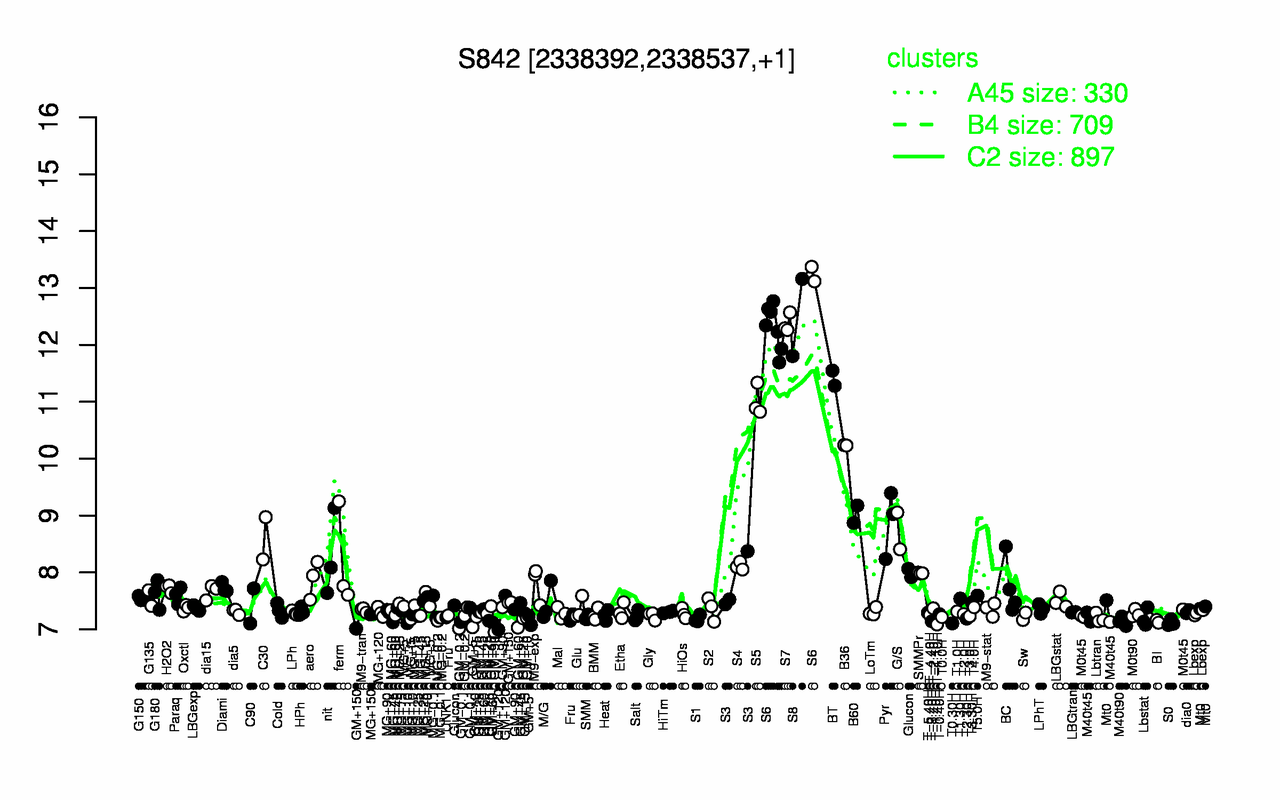
| S6 | S8 | S7 | BT | S5 | B36 | B60 | Pyr | G/S | C30 |
| 12.5 | 12.5 | 12.4 | 11.4 | 11 | 10.2 | 9.02 | 8.89 | 8.73 | 8.6 |
| T-1.10H | T0.30H | T-1.40H | GM+5 | S0 | M40t90 | BI | T-3.40H | GM+60 | MG+t5 |
| 7.09 | 7.11 | 7.12 | 7.12 | 7.12 | 7.14 | 7.14 | 7.14 | 7.17 | 7.18 |