B. subtilis Expression Data Browser
Details about S879 Show/Hide
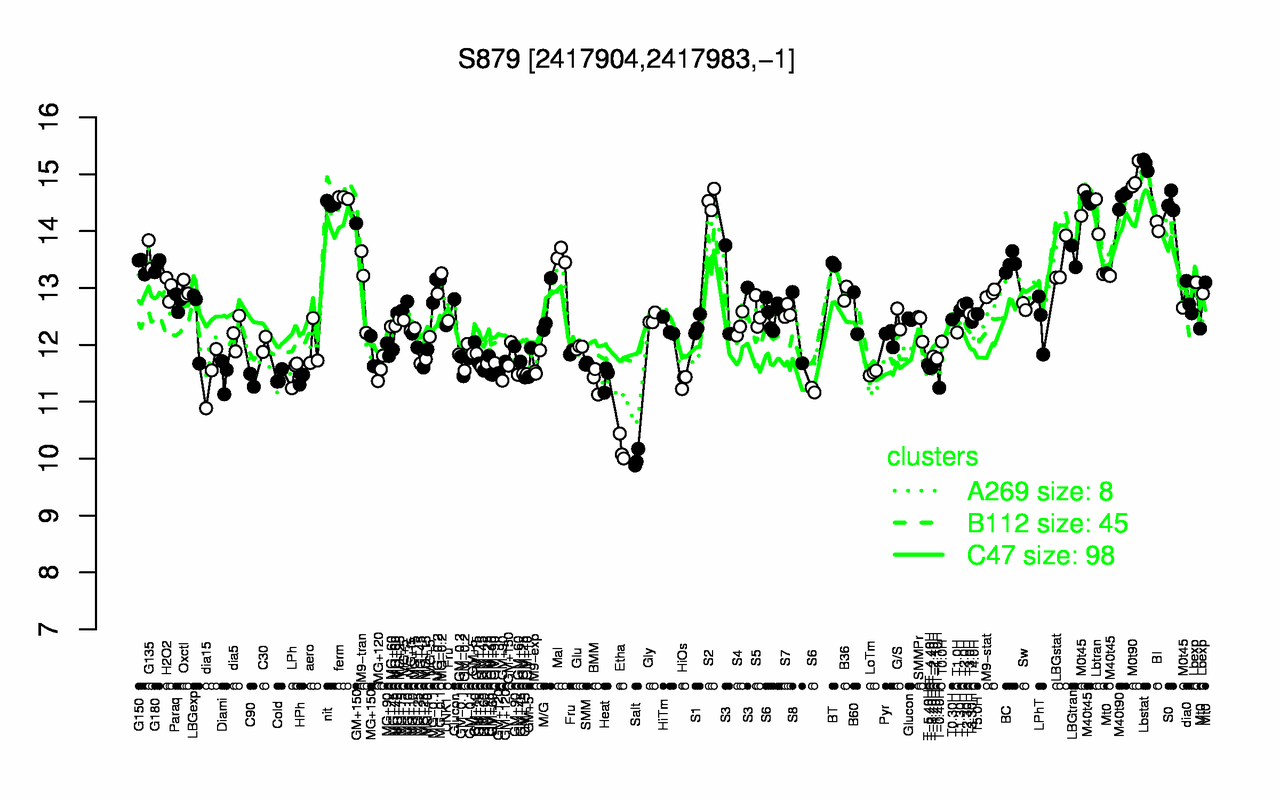
Highest Expression Conditions
Lbstat M0t90 ferm M40t90 S2 S0 nit M40t45 BI Lbtran
15.2 15 14.6 14.6 14.5 14.5 14.5 14.1 14.1 13.9
Lowest Expression Conditions
Salt Etha T-0.40H HiOs BMM C90 HPh Heat Cold dia15
10 10.2 11.2 11.4 11.4 11.4 11.4 11.4 11.4 11.5
Most Positively Correlated Segments
resC resD resE resB fnr ydzA ctaA ytkA S1172 ydhE
0.98 0.96 0.94 0.94 0.83 0.83 0.82 0.82 0.8 0.79
Most Negatively Correlated Segments
S236 S1298 S1063 yosU NA S1332 opuE opuCA sapB hisB
-0.57 -0.57 -0.56 -0.55 -0.55 -0.55 -0.54 -0.54 -0.54 -0.54
Expression Profile of Segment S879 Show/Hide
Genomic View of Gene/Segment S879 Show/Hide
(Legend)