| Start Page |
|
 |
| Start Page |
|
|
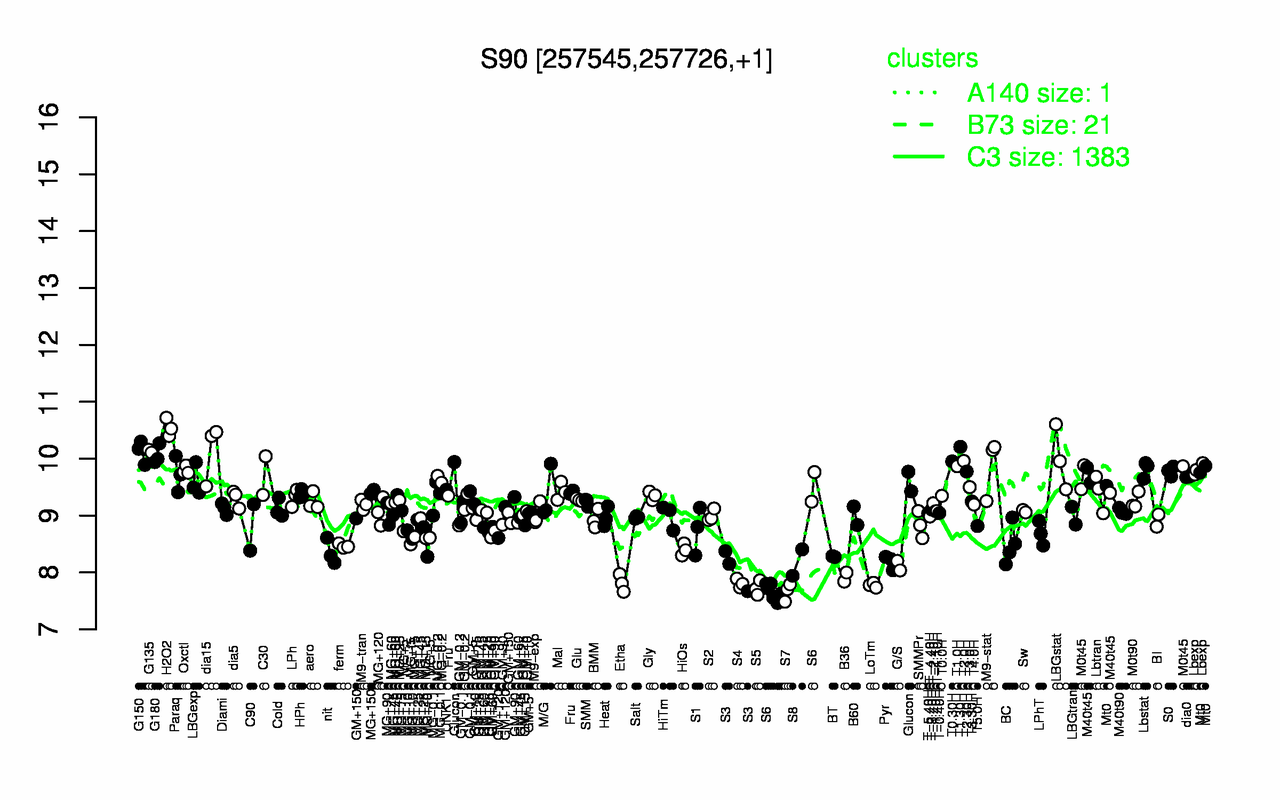
| H2O2 | T1.30H | G135 | dia15 | G150 | G180 | LBGstat | T2.0H | T0.30H | M9-stat |
| 10.5 | 10.2 | 10.1 | 10.1 | 10.1 | 10.1 | 10 | 9.96 | 9.95 | 9.87 |
| S7 | S5 | LoTm | S4 | Etha | B36 | S6 | S3 | G/S | S8 |
| 7.66 | 7.72 | 7.78 | 7.81 | 7.81 | 7.92 | 8.06 | 8.07 | 8.12 | 8.17 |