| Start Page |
|
 |
| Start Page |
|
|
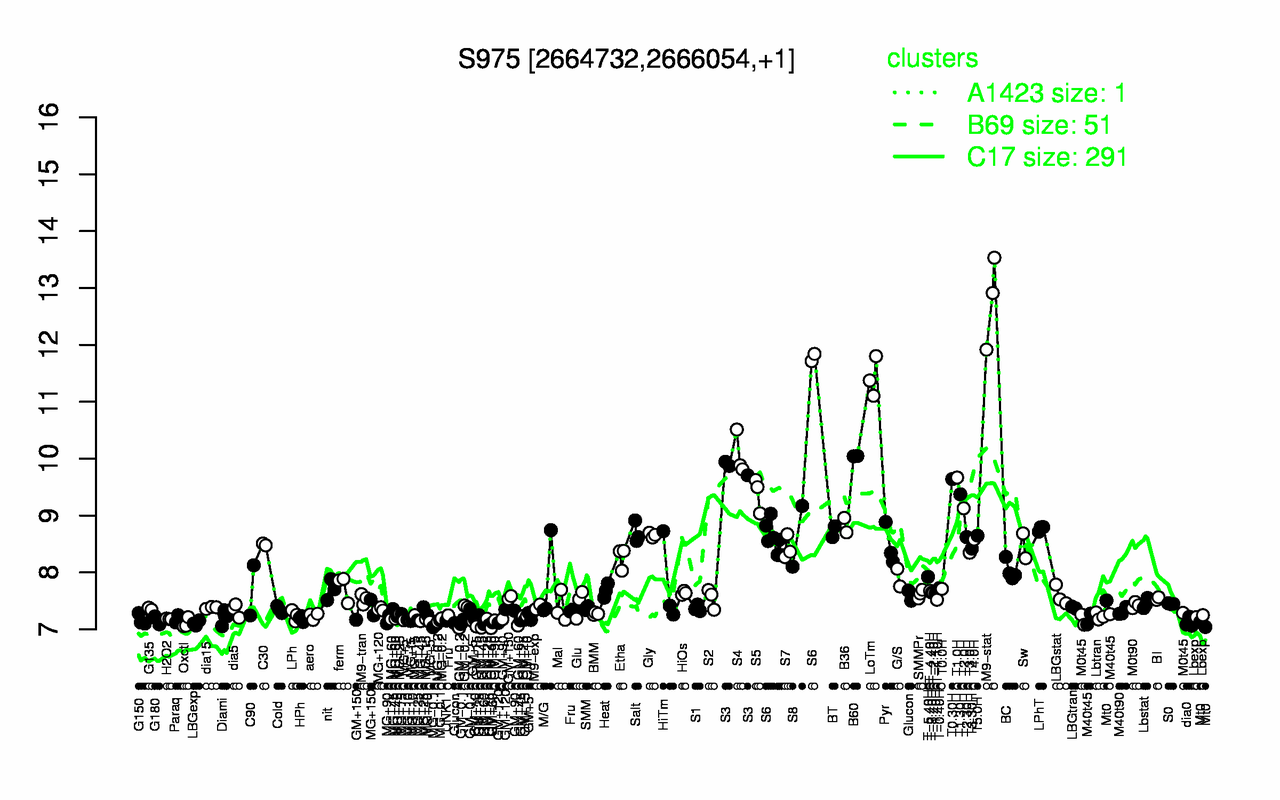
| M9-stat | LoTm | S4 | B60 | S3 | T1.0H | T0.30H | S5 | T1.30H | S6 |
| 12.8 | 11.4 | 10.1 | 10 | 9.84 | 9.67 | 9.64 | 9.39 | 9.37 | 9.31 |
| GM+45 | GM+60 | MG-0.1 | GM+15 | LBGexp | Oxctl | dia0 | MG+5 | MG+t5 | UNK1 |
| 7.07 | 7.09 | 7.09 | 7.1 | 7.11 | 7.11 | 7.12 | 7.14 | 7.15 | 7.15 |