| Start Page |
|
 |
| Start Page |
|
|
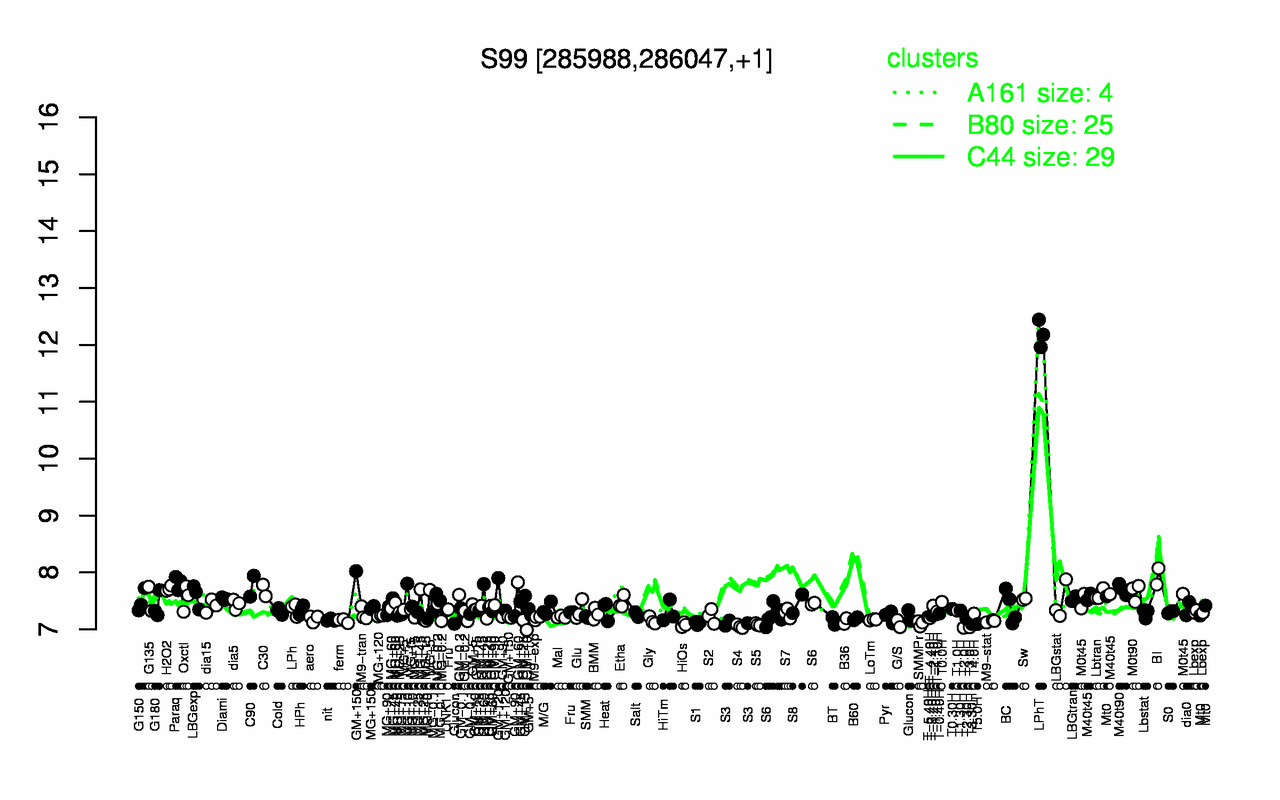
| LPhT | BI | Paraq | C90 | H2O2 | M40t90 | C30 | M0t90 | GM+60 | GM+120 |
| 12.2 | 7.93 | 7.82 | 7.76 | 7.72 | 7.7 | 7.68 | 7.65 | 7.64 | 7.62 |
| T2.0H | T3.0H | S4 | HiOs | S5 | T3.30H | T5.0H | G/S | SMMPr | S3 |
| 7.03 | 7.04 | 7.05 | 7.08 | 7.08 | 7.09 | 7.1 | 7.1 | 7.1 | 7.11 |