| Start Page |
|
 |
| Start Page |
|
|
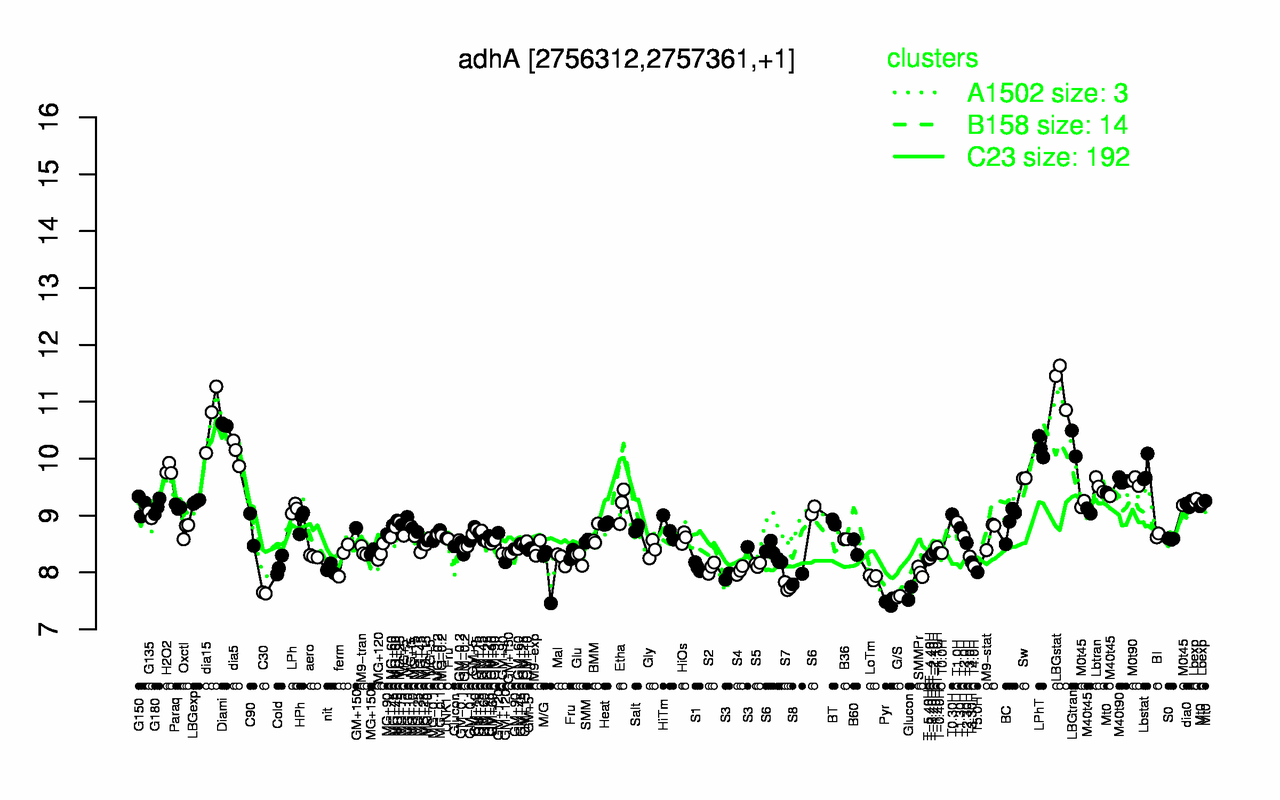
| LBGstat | dia15 | Diami | LBGtran | LPhT | dia5 | H2O2 | Lbstat | Sw | M40t90 |
| 11.3 | 10.7 | 10.6 | 10.3 | 10.2 | 10.1 | 9.81 | 9.8 | 9.65 | 9.62 |
| Pyr | G/S | C30 | S7 | S8 | Glucon | LoTm | T5.0H | SMMPr | S4 |
| 7.48 | 7.58 | 7.64 | 7.75 | 7.88 | 7.91 | 7.91 | 8 | 8.01 | 8.03 |