| Start Page |
|
 |
| Start Page |
|
|
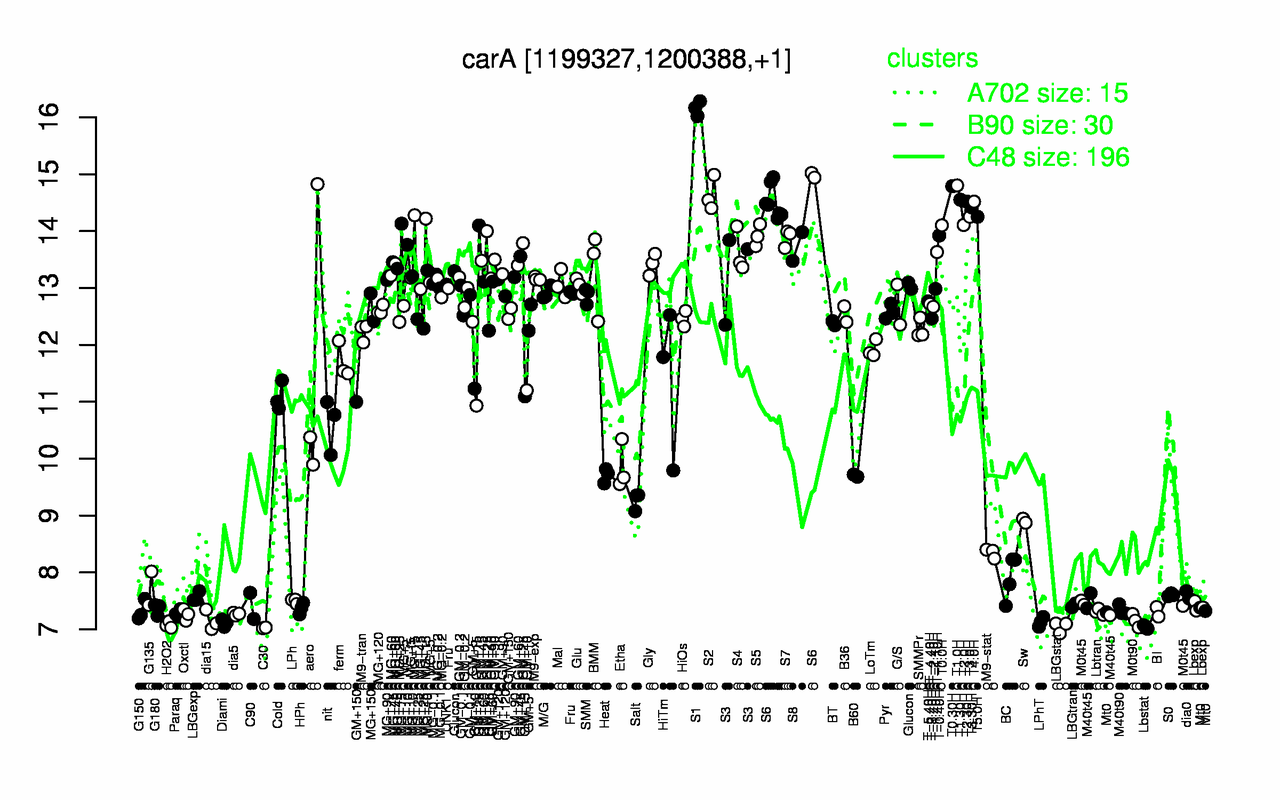
| S1 | T1.0H | T0.30H | S2 | S6 | T1.30H | T2.30H | T4.0H | T3.30H | T3.0H |
| 16.2 | 14.8 | 14.8 | 14.6 | 14.6 | 14.6 | 14.5 | 14.5 | 14.4 | 14.3 |
| C30 | Lbstat | LBGstat | H2O2 | Diami | LPhT | M0t90 | dia15 | Oxctl | dia5 |
| 7.03 | 7.04 | 7.04 | 7.08 | 7.11 | 7.13 | 7.15 | 7.15 | 7.26 | 7.27 |