| Start Page |
|
 |
| Start Page |
|
|
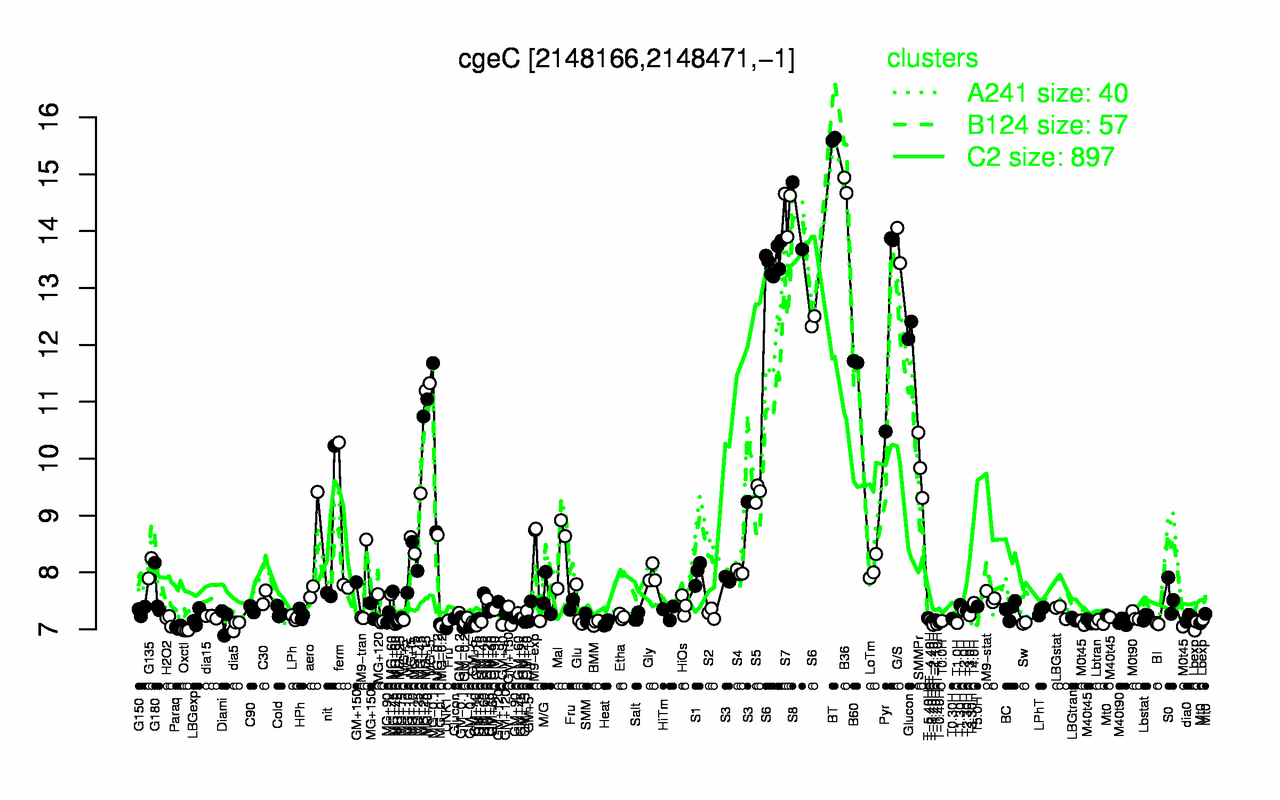
| BT | B36 | S7 | S8 | G/S | S6 | Pyr | B60 | Glucon | SMMPr |
| 15.6 | 14.8 | 14.4 | 14.3 | 13.7 | 13.2 | 12.7 | 11.7 | 10.6 | 9.87 |
| Oxctl | UNK1 | Paraq | dia5 | T-2.40H | T-1.10H | Lbexp | M0t45 | GM-0.1 | BI |
| 6.98 | 7.02 | 7.04 | 7.07 | 7.08 | 7.09 | 7.09 | 7.09 | 7.1 | 7.1 |