| Start Page |
|
 |
| Start Page |
|
|
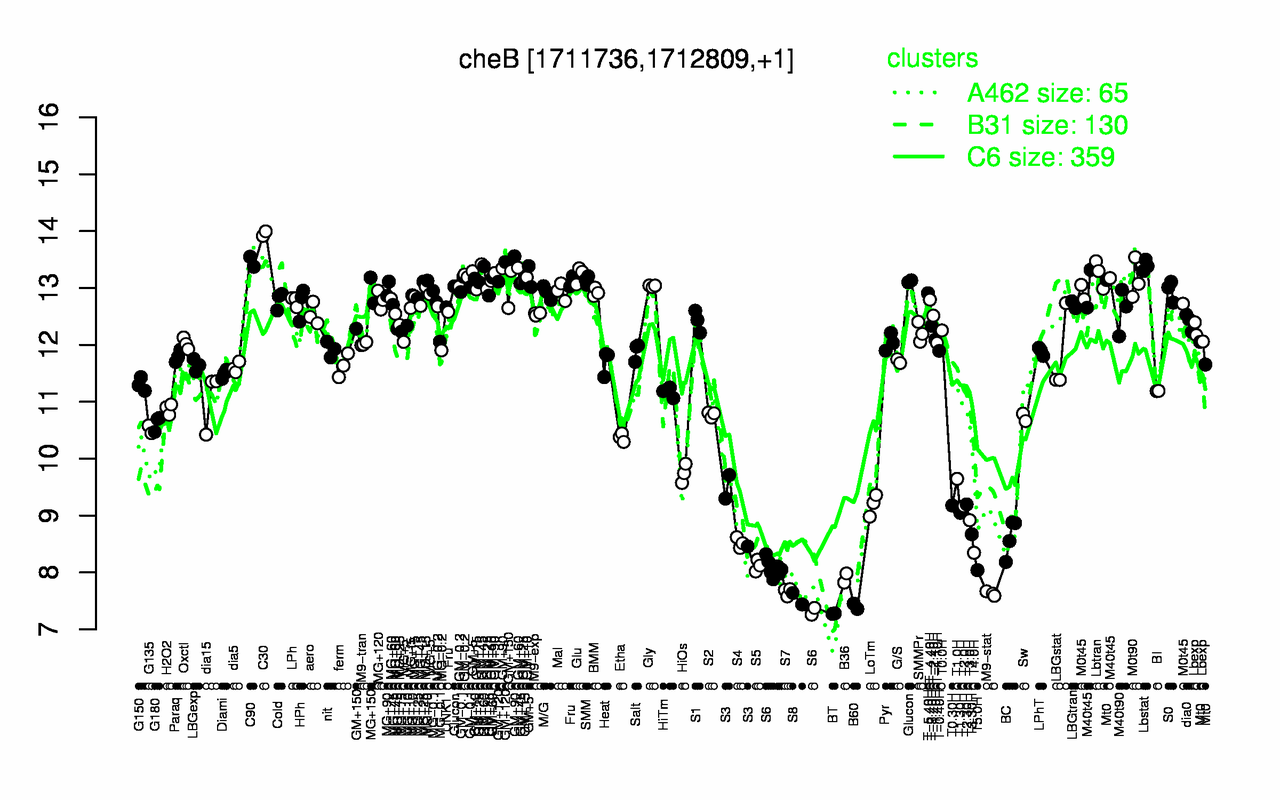
| C30 | C90 | Lbstat | GM+90 | GM+60 | GM+120 | Lbtran | GM+5 | Glu | GM+45 |
| 14 | 13.5 | 13.4 | 13.4 | 13.3 | 13.3 | 13.3 | 13.2 | 13.2 | 13.2 |
| BT | B60 | S8 | M9-stat | S7 | B36 | S6 | T5.0H | S5 | T4.0H |
| 7.28 | 7.41 | 7.54 | 7.63 | 7.66 | 7.9 | 7.91 | 8.04 | 8.12 | 8.35 |