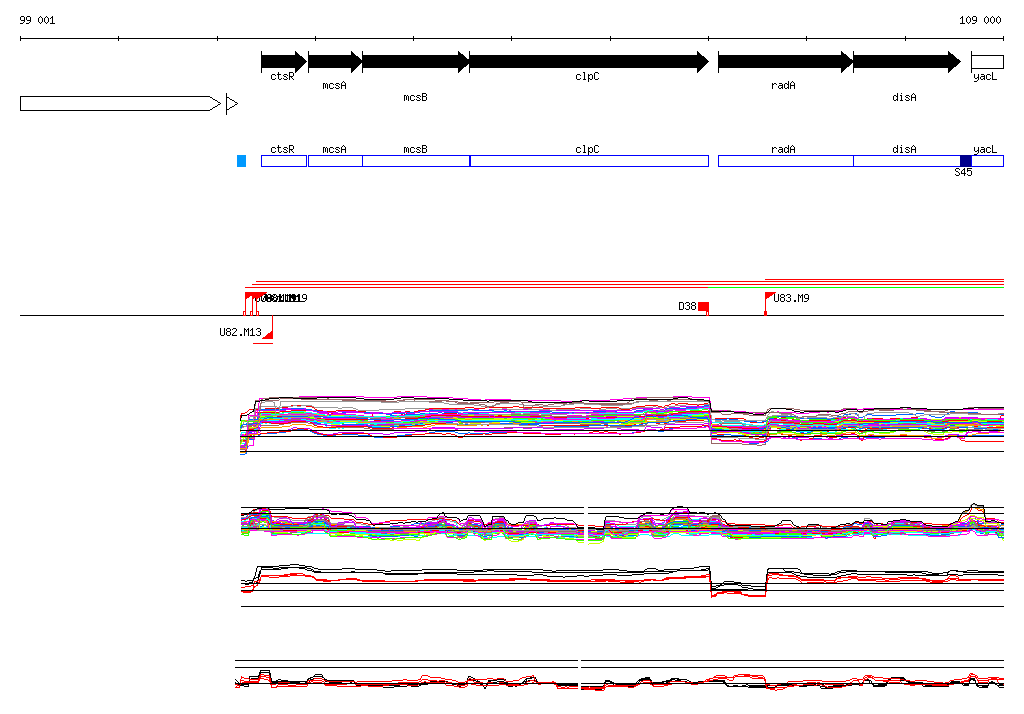
| Start Page |
|
 |
| Start Page |
|
|
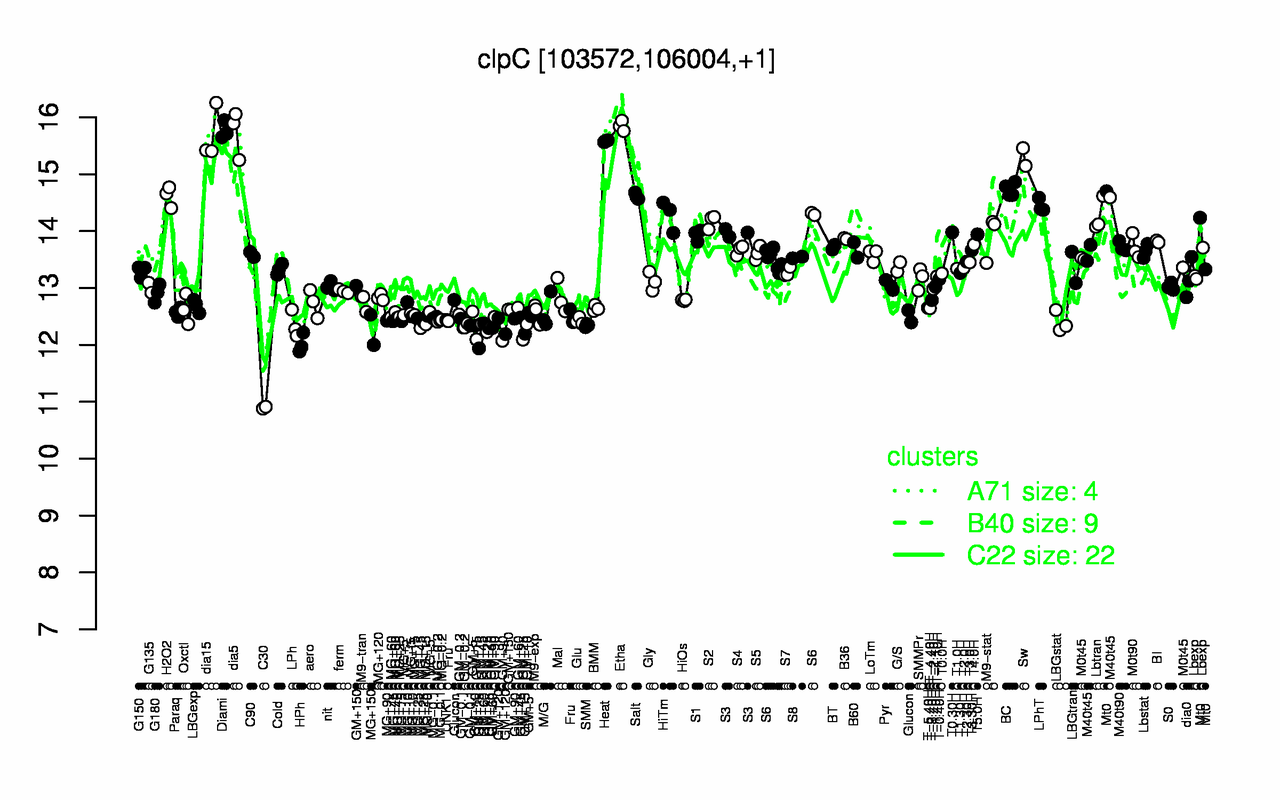
| Etha | Diami | dia5 | dia15 | Heat | Sw | BC | Salt | H2O2 | LPhT |
| 15.8 | 15.8 | 15.7 | 15.7 | 15.6 | 15.3 | 14.7 | 14.6 | 14.6 | 14.5 |
| C30 | HPh | GM+25 | GM+15 | MG+150 | GM+120 | GM+90 | SMM | GM+10 | LPh |
| 10.9 | 12 | 12.1 | 12.2 | 12.3 | 12.3 | 12.3 | 12.3 | 12.4 | 12.4 |