B. subtilis Expression Data Browser
Start Page
B. subtilis Expression Data Browser
Gene/Segment:
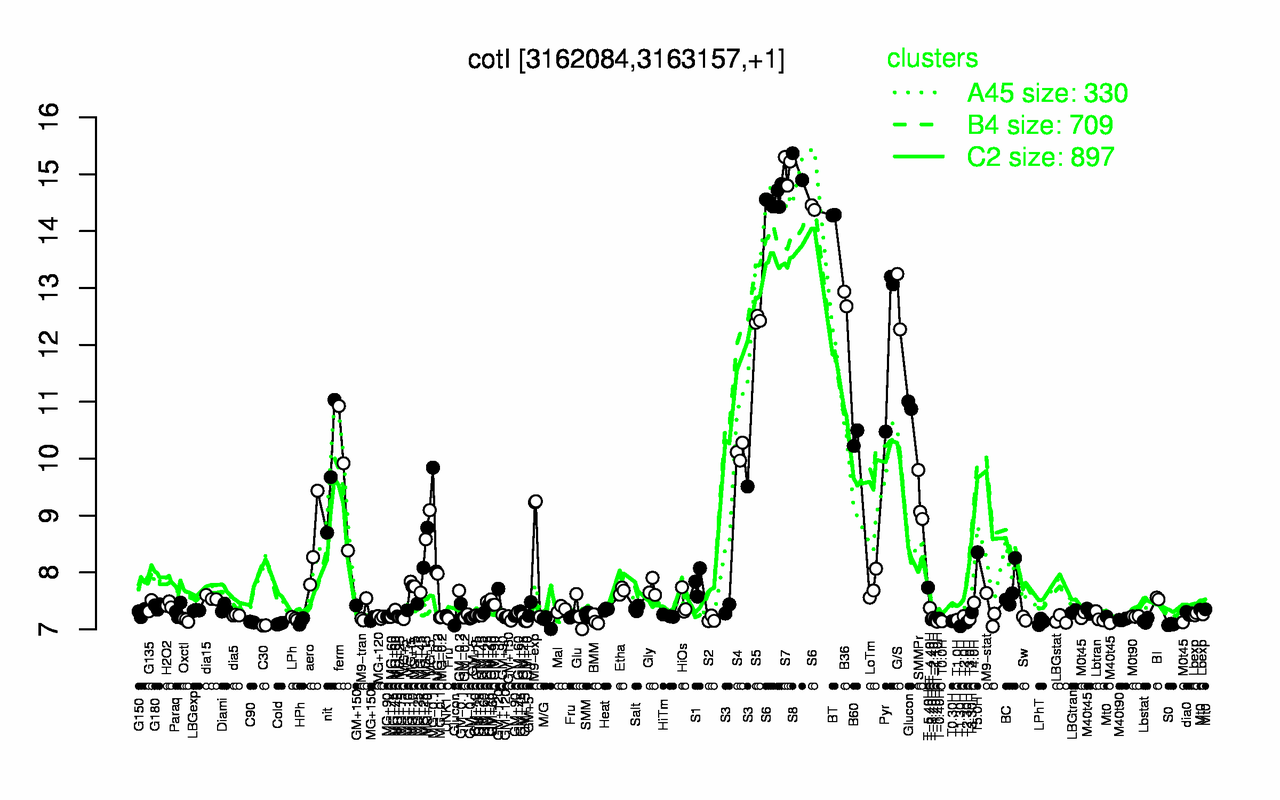
cotI
Locus Tag:
BSU30920
Details about cotI
Show/Hide
Highest Expression Conditions
S8
S7
S6
BT
B36
G/S
S5
Pyr
B60
S4
15.1
15.1
14.5
14.3
12.8
12.8
12.4
12.2
10.4
10.1
Lowest Expression Conditions
T1.30H
C30
S0
Cold
T2.30H
C90
LPhT
T-1.10H
M/G
T0.0H
7.06
7.07
7.09
7.1
7.12
7.13
7.13
7.13
7.14
7.14
Most Positively Correlated Segments
spoVFA
spsA
S598
spoVFB
yjzK
spsB
cotB
yqfQ
ytcA
gerT
0.98
0.98
0.98
0.98
0.98
0.98
0.98
0.97
0.97
0.97
Most Negatively Correlated Segments
bceR
yeaC
bceS
pbpD
ykuH
S1355
moeB
dnaB
aroC
yvpB
-0.85
-0.84
-0.83
-0.82
-0.81
-0.81
-0.81
-0.81
-0.81
-0.81
Expression Profile of Segment cotI
Show/Hide
Annotation of Gene cotI
Show/Hide
function
16.8: Protect
function
16.13: Shape
function
16.5: Explore
inference
ab initio prediction:AMIGene:2.0
codon_start
1
product
spore coat protein
transl_table
11
note
Evidence 1a: Function experimentally demonstrated in the studied strain; PubMedId: 12562816; Product type f: factor
db_xref
GI:2635576
protein_id
CAB15070.1
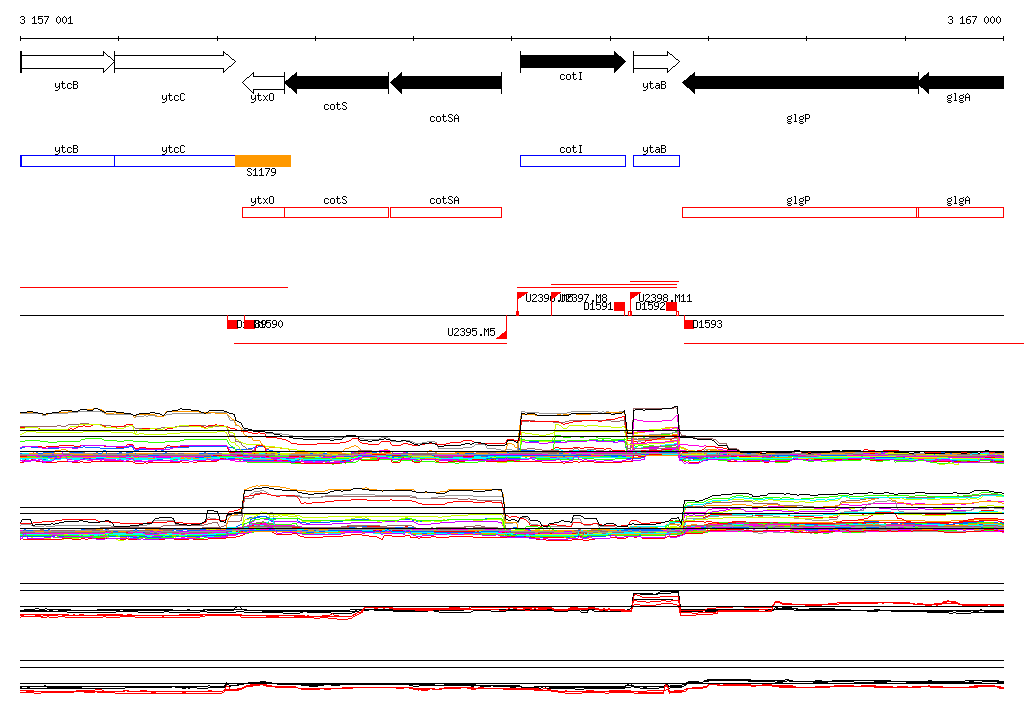
Genomic View of Gene/Segment cotI
Show/Hide
(Legend)
Browse Genome Context