B. subtilis Expression Data Browser
Start Page
B. subtilis Expression Data Browser
Gene/Segment:
dhbA
Locus Tag:
BSU32000
Details about dhbA
Show/Hide
Highest Expression Conditions
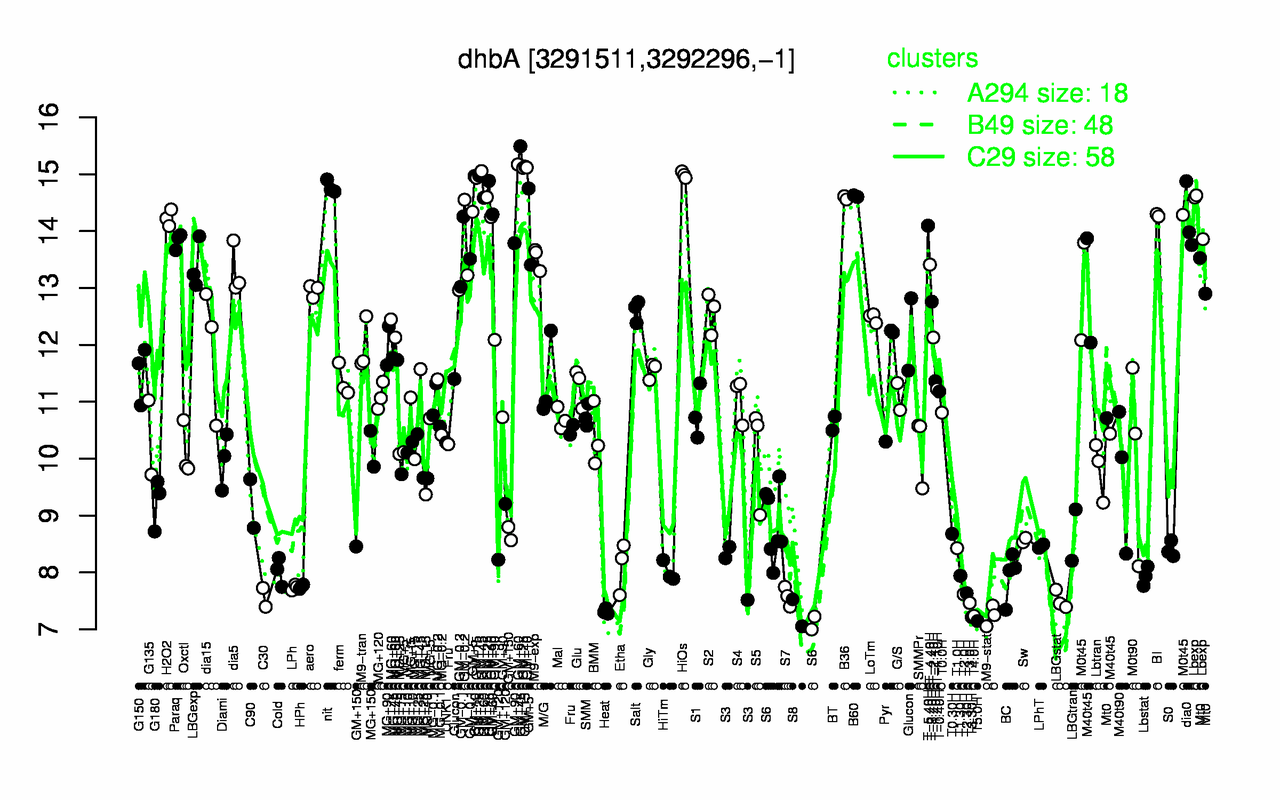
GM+10
HiOs
GM+15
GM+45
GM+25
nit
GM+60
B60
B36
Lbexp
15
15
15
14.9
14.9
14.8
14.7
14.6
14.6
14.4
Lowest Expression Conditions
T5.0H
T3.30H
T4.0H
M9-stat
S8
Heat
T3.0H
LBGstat
C30
S7
7.15
7.22
7.24
7.24
7.29
7.32
7.46
7.51
7.56
7.58
Most Positively Correlated Segments
dhbC
dhbE
dhbB
S1228
S1229
dhbF
besA
ybdZ
S1230
ykuO
1
0.99
0.99
0.98
0.97
0.97
0.96
0.92
0.92
0.92
Most Negatively Correlated Segments
ymcA
S502
yheH
zosA
S794
S1087
yqaD
S341
yesS
yheI
-0.52
-0.51
-0.49
-0.48
-0.48
-0.47
-0.47
-0.47
-0.47
-0.47
Expression Profile of Segment dhbA
Show/Hide
Annotation of Gene dhbA
Show/Hide
function
16.11: Scavenge (Catabolism)
function
16.2: Construct biomass (Anabolism)
inference
ab initio prediction:AMIGene:2.0
codon_start
1
EC_number
1.3.1.28
transl_table
11
note
Evidence 2a: Function of homologous gene experimentally demonstrated in an other organism; PubMedId: 12354229, 16672620; Product type e: enzyme
db_xref
GI:225185362
product
2,3-dihydro-2,3-dihydroxybenzoate dehydrogenase
protein_id
CAB15190.2
Genomic View of Gene/Segment dhbA
Show/Hide
(Legend)
Browse Genome Context