| Start Page |
|
 |
| Start Page |
|
|
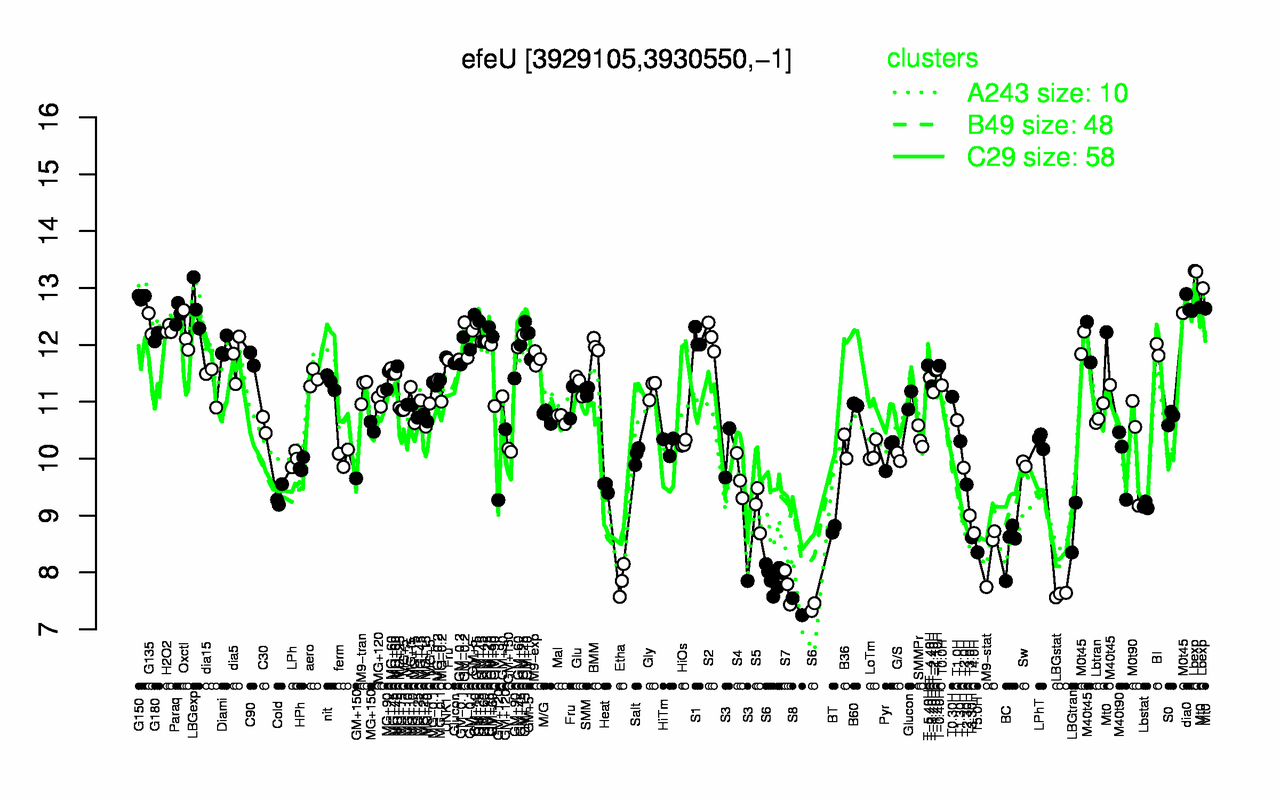
| Lbexp | G150 | dia0 | LBGexp | Paraq | Mt0 | G135 | GM+15 | GM+10 | H2O2 |
| 13.2 | 12.8 | 12.7 | 12.7 | 12.5 | 12.5 | 12.4 | 12.4 | 12.4 | 12.3 |
| S8 | LBGstat | S7 | S6 | Etha | M9-stat | T5.0H | BC | T3.30H | T4.0H |
| 7.4 | 7.61 | 7.76 | 7.8 | 7.86 | 8.34 | 8.35 | 8.47 | 8.62 | 8.69 |