B. subtilis Expression Data Browser
Start Page
B. subtilis Expression Data Browser
Gene/Segment:
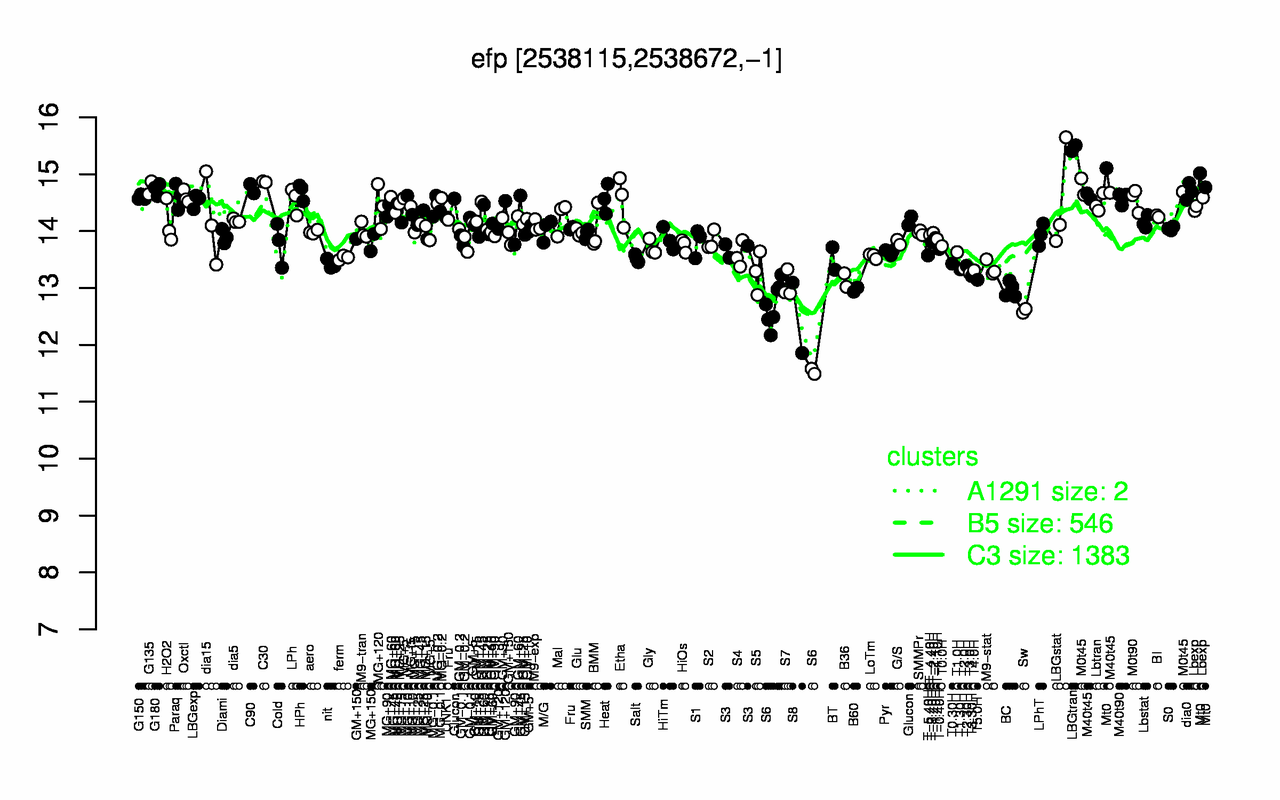
efp
Locus Tag:
BSU24450
Details about efp
Show/Hide
Highest Expression Conditions
LBGtran
Mt0
C30
G135
M0t45
C90
G180
dia0
HPh
M40t45
15.5
15
14.9
14.8
14.8
14.7
14.7
14.7
14.7
14.6
Lowest Expression Conditions
S6
S8
Sw
BC
B60
S7
B36
T5.0H
T3.30H
T3.0H
12.5
12.5
12.6
13
13
13.1
13.1
13.1
13.2
13.3
Most Positively Correlated Segments
ppiB
yqhT
ywtE
pfkA
yrbF
pncB
ykrK
fabL
pgi
deoD
0.86
0.85
0.84
0.84
0.83
0.83
0.83
0.83
0.82
0.82
Most Negatively Correlated Segments
ybbC
ybbD
skfA
mpr
S738
S472
ybbE
yoyB
S77
ybfJ
-0.75
-0.75
-0.73
-0.73
-0.73
-0.73
-0.73
-0.73
-0.72
-0.72
Expression Profile of Segment efp
Show/Hide
Annotation of Gene efp
Show/Hide
function
16.2: Construct biomass (Anabolism)
function
16.6: Maintain
inference
ab initio prediction:AMIGene:2.0
codon_start
1
product
elongation factor P
transl_table
11
note
Evidence 2a: Function of homologous gene experimentally demonstrated in an other organism; PubMedId: 14586115, 15066026, 15210970, 16014871, 1956781; Product type f: factor
db_xref
GI:225185175
protein_id
CAB14376.2
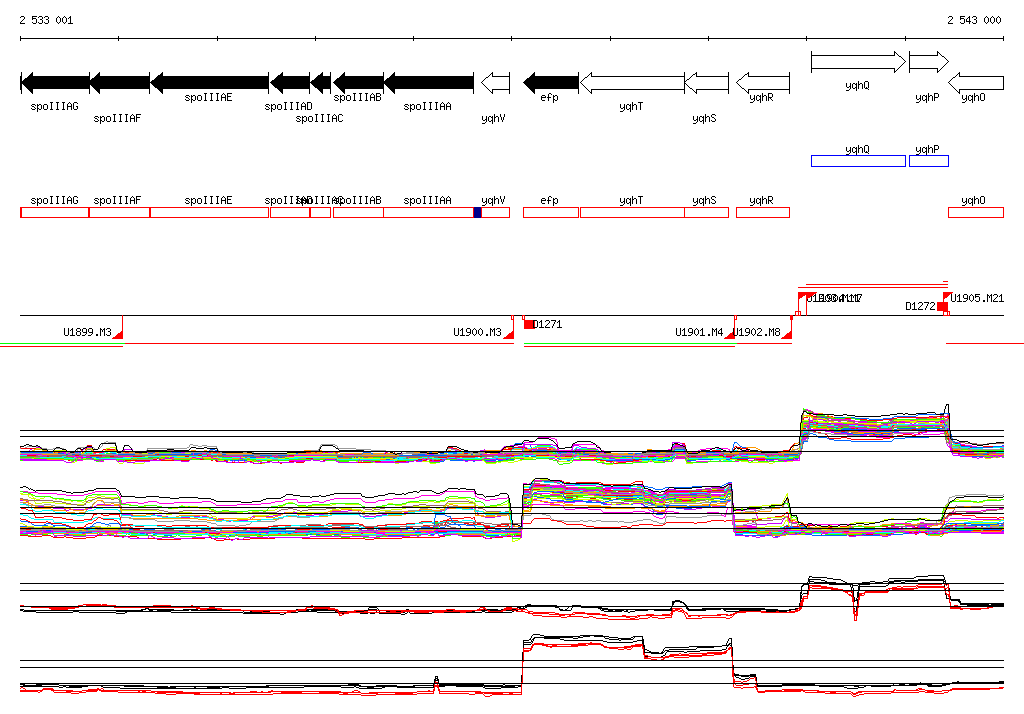
Genomic View of Gene/Segment efp
Show/Hide
(Legend)
Browse Genome Context