B. subtilis Expression Data Browser
Details about ftsH Show/Hide
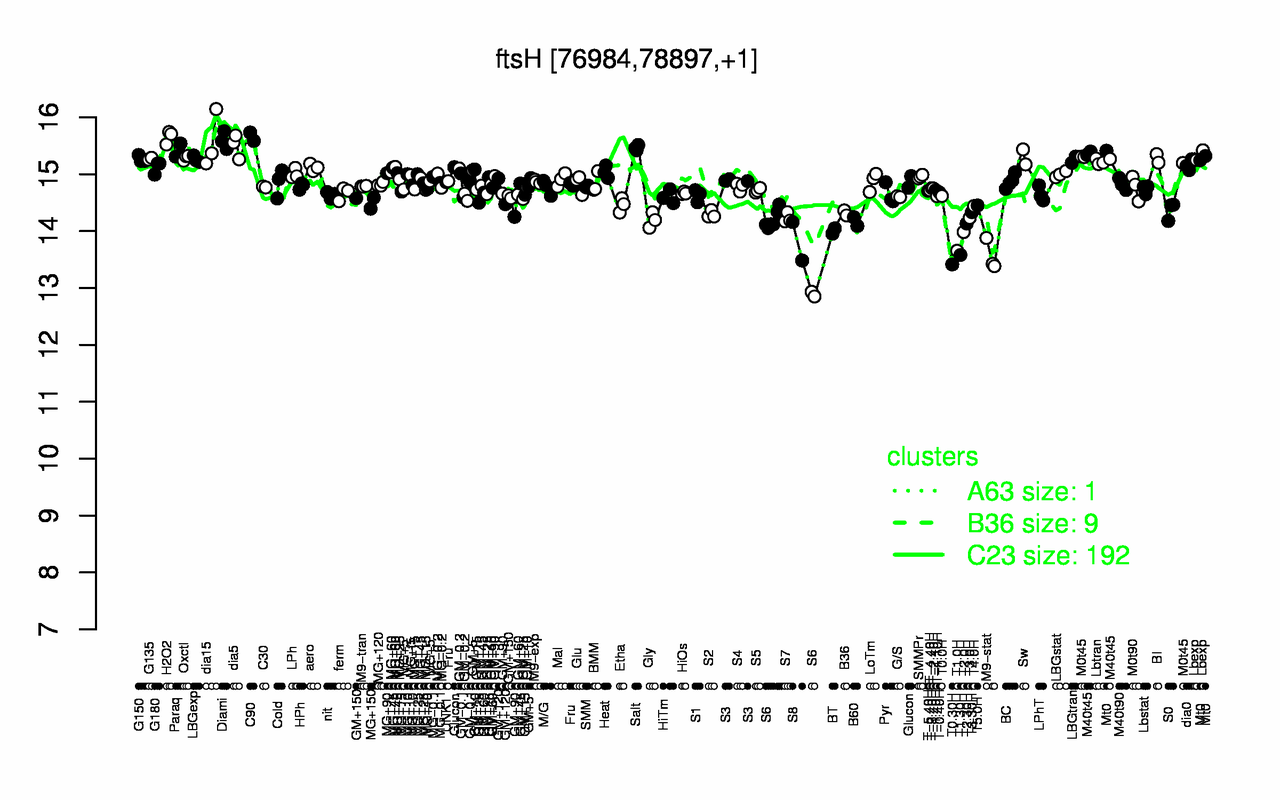
Highest Expression Conditions
C90 H2O2 Diami dia15 dia5 Salt Paraq M40t45 Mt0 Lbexp
15.7 15.7 15.6 15.6 15.5 15.5 15.4 15.3 15.3 15.3
Lowest Expression Conditions
T0.30H M9-stat T1.30H T1.0H S8 S6 T2.0H BT T2.30H B60
13.4 13.6 13.6 13.7 13.8 13.9 14 14 14.1 14.2
Most Positively Correlated Segments
gltX S38 glmM ppnKA yojF ybbR rseP yjbM yllA ytpR
0.86 0.82 0.81 0.79 0.79 0.79 0.78 0.78 0.78 0.78
Most Negatively Correlated Segments
S717 S978 yhzC ykwB rapA phrA S1534 ytzJ yjaZ S1088
-0.72 -0.72 -0.69 -0.68 -0.68 -0.67 -0.67 -0.66 -0.66 -0.65
Expression Profile of Segment ftsH Show/Hide
Annotation of Gene ftsH Show/Hide
function
16.9: Replicate
function
16.13: Shape
inference
ab initio prediction:AMIGene:2.0
codon_start
1
EC_number
3.4.24.-
transl_table
11
note
Evidence 1a: Function experimentally demonstrated in the studied strain; PubMedId: 10851010, 10913836, 12533473, 9076729, 9084181, 9287010, 9352926; Product type e: enzyme
db_xref
GI:2632336
product
cell-division protein and general stress protein (class III heat-shock)
protein_id
CAB11845.1
Genomic View of Gene/Segment ftsH Show/Hide
(Legend)