| Start Page |
|
 |
| Start Page |
|
|
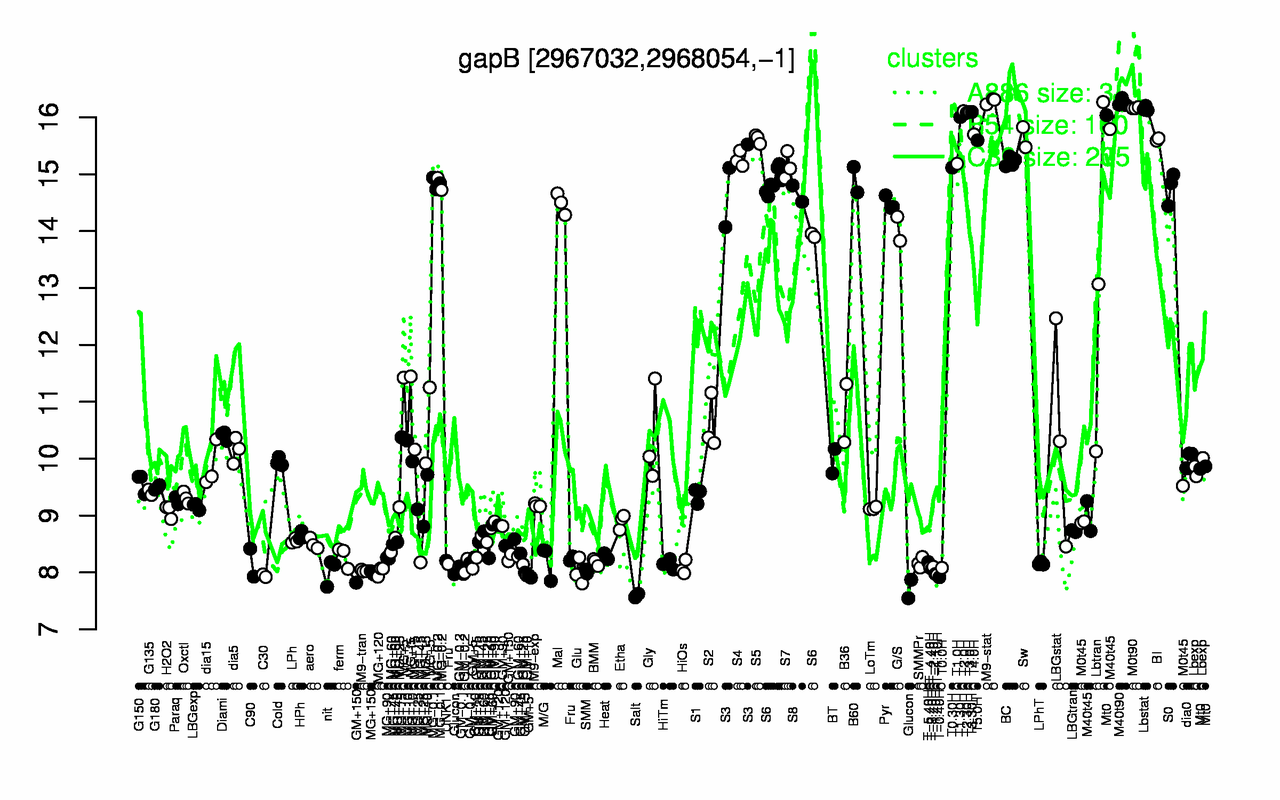
| M9-stat | M40t90 | M0t90 | Lbstat | T2.0H | T3.0H | T3.30H | T2.30H | T1.30H | T4.0H |
| 16.3 | 16.3 | 16.2 | 16.2 | 16.1 | 16.1 | 16.1 | 16.1 | 16 | 15.7 |
| Salt | Glucon | T-0.40H | C30 | T-1.10H | GM+5 | T-1.40H | MG+150 | Glu | MG+120 |
| 7.59 | 7.8 | 7.92 | 7.94 | 7.96 | 7.97 | 7.98 | 7.99 | 8.01 | 8.02 |