| Start Page |
|
 |
| Start Page |
|
|
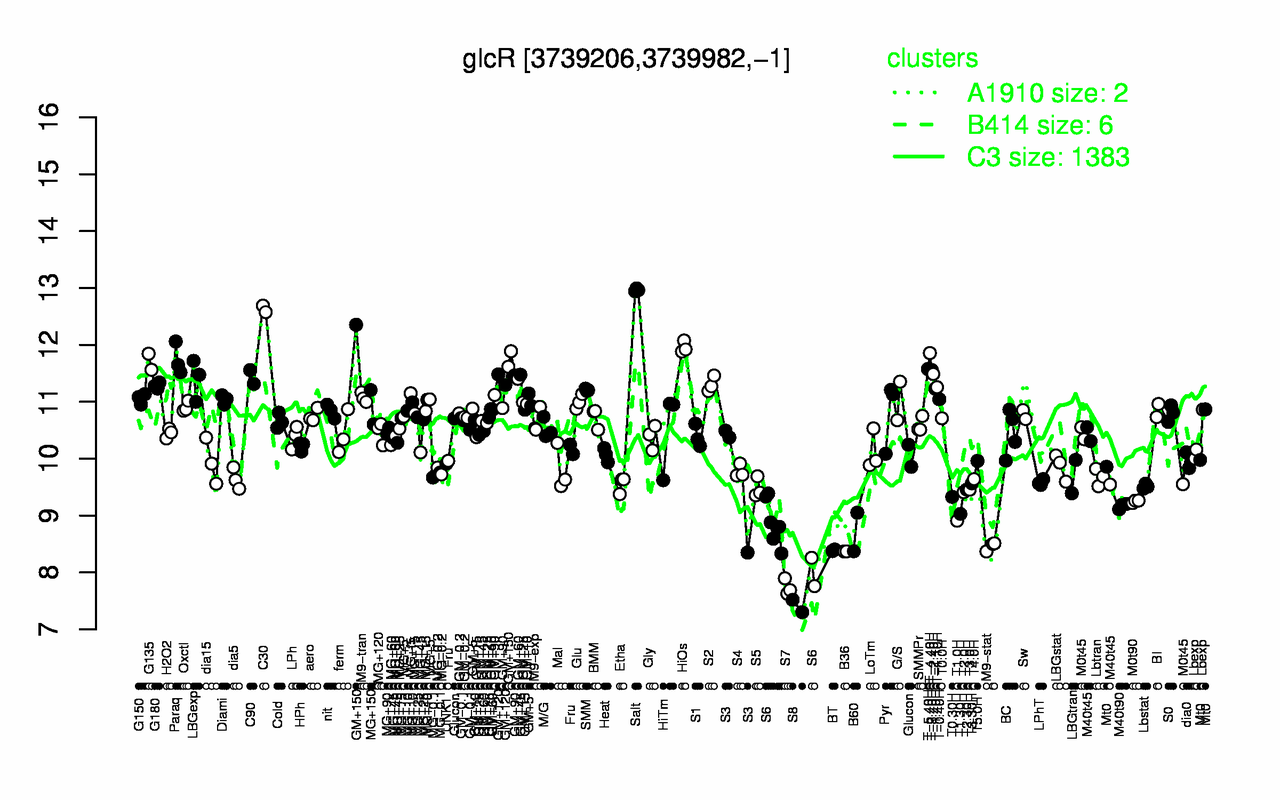
| Salt | C30 | HiOs | GM+150 | T-4.40H | Paraq | G135 | T-5.40H | T-3.40H | T-2.40H |
| 13 | 12.6 | 12 | 12 | 11.9 | 11.7 | 11.7 | 11.6 | 11.6 | 11.5 |
| S8 | S7 | B36 | BT | M9-stat | S6 | B60 | T1.0H | T1.30H | M40t90 |
| 7.41 | 7.74 | 8.37 | 8.39 | 8.46 | 8.68 | 8.71 | 8.91 | 9.03 | 9.17 |