| Start Page |
|
 |
| Start Page |
|
|
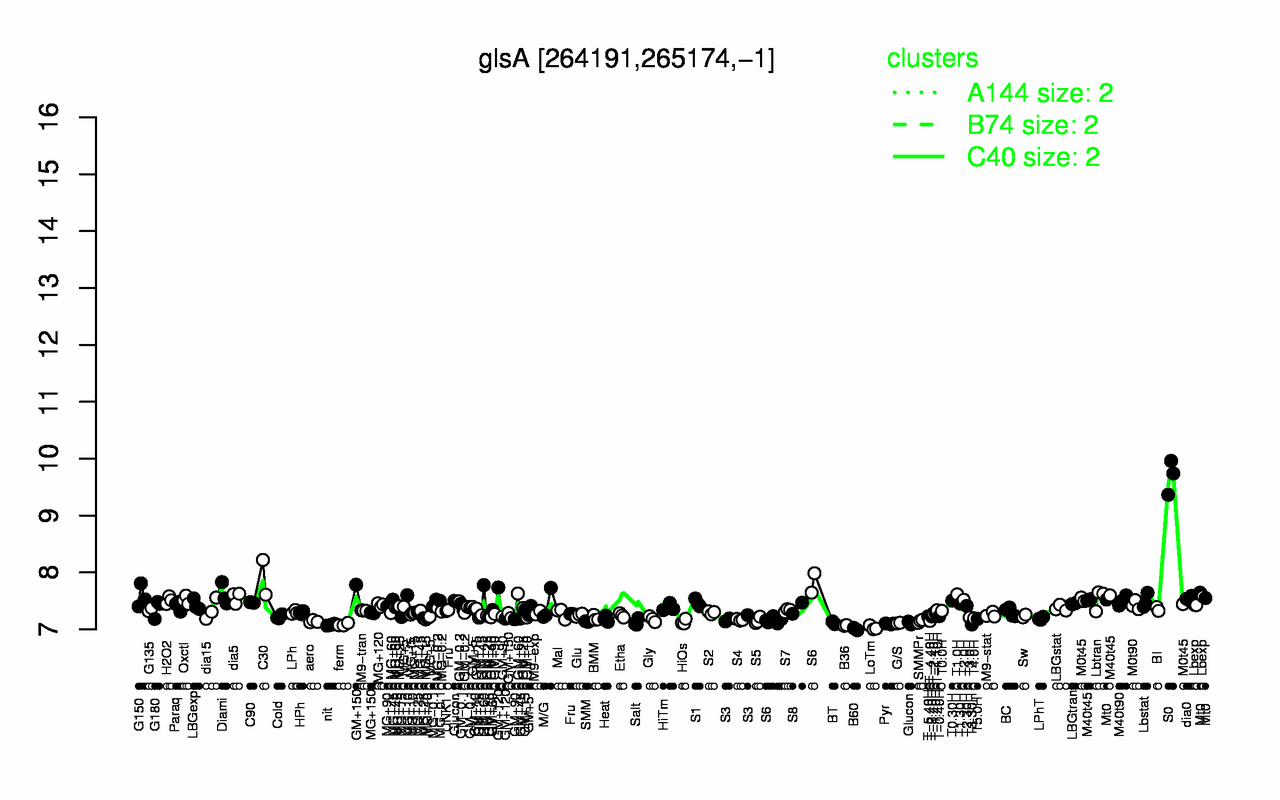
| S0 | C30 | T1.0H | Diami | GM+60 | G150 | Mt0 | dia5 | dia0 | M40t45 |
| 9.69 | 7.91 | 7.61 | 7.61 | 7.58 | 7.58 | 7.57 | 7.56 | 7.54 | 7.54 |
| B60 | LoTm | B36 | nit | ferm | T3.30H | Pyr | G/S | BT | Salt |
| 7 | 7.03 | 7.07 | 7.08 | 7.08 | 7.09 | 7.1 | 7.11 | 7.12 | 7.13 |