| Start Page |
|
 |
| Start Page |
|
|
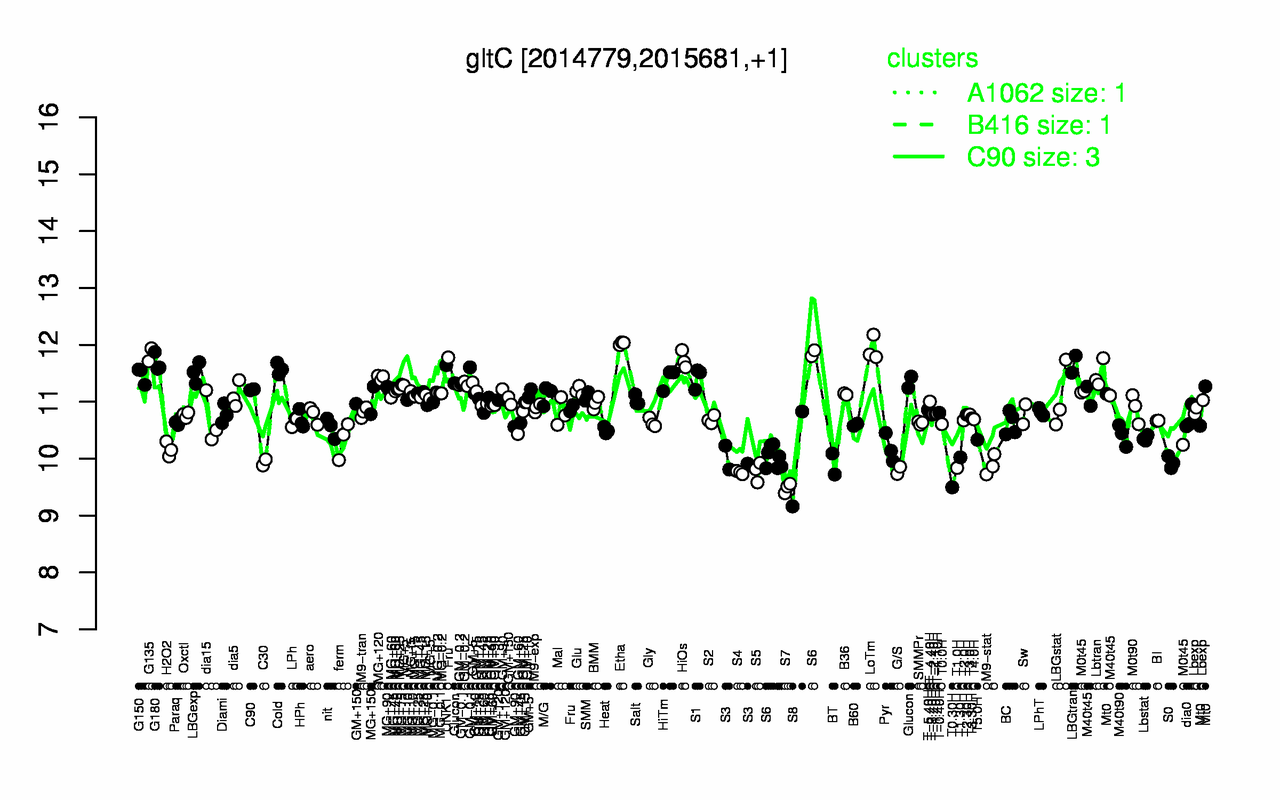
| Etha | LoTm | G135 | HiOs | G180 | LBGtran | UNK1 | Cold | LBGexp | Lbtran |
| 12 | 11.9 | 11.8 | 11.7 | 11.7 | 11.7 | 11.6 | 11.6 | 11.5 | 11.5 |
| S7 | T0.30H | S4 | S5 | G/S | T1.0H | M9-stat | BT | C30 | S0 |
| 9.49 | 9.5 | 9.76 | 9.77 | 9.79 | 9.84 | 9.89 | 9.91 | 9.93 | 9.94 |