B. subtilis Expression Data Browser
Start Page
B. subtilis Expression Data Browser
Gene/Segment:
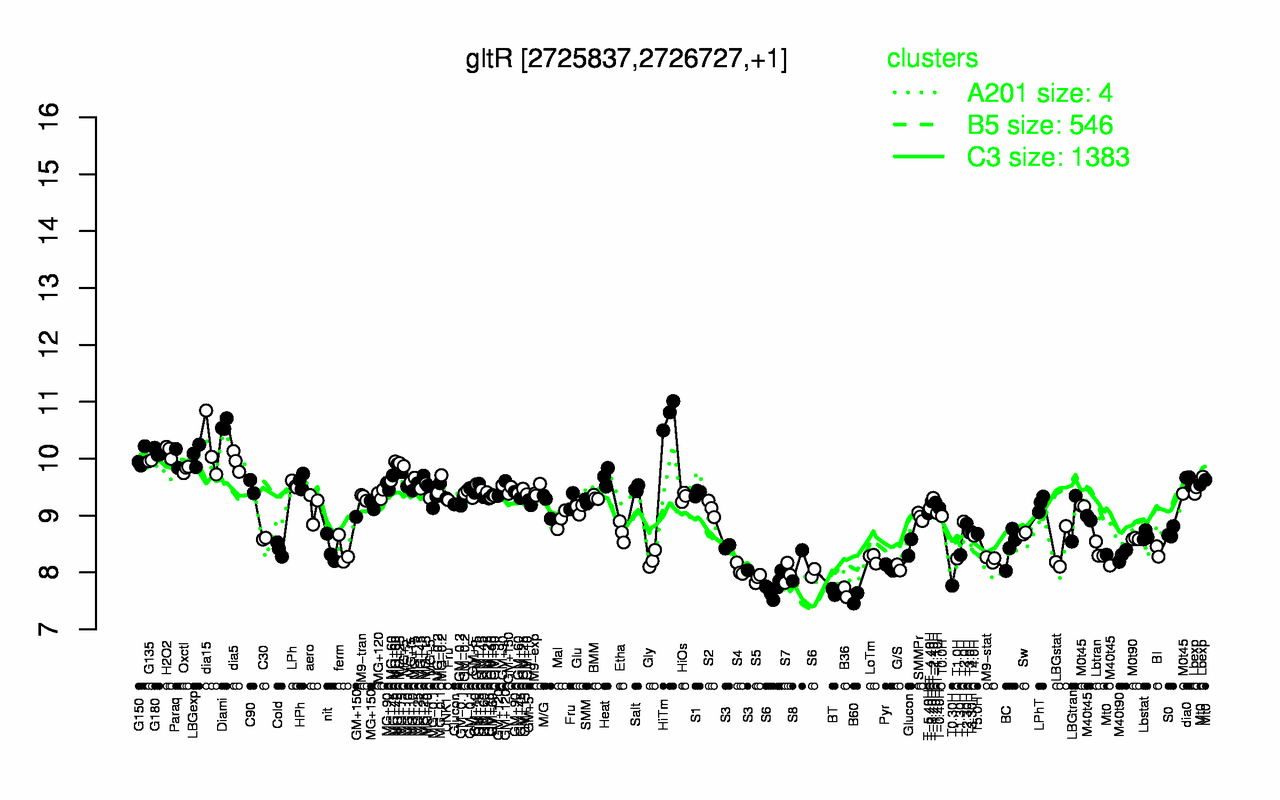
gltR
Locus Tag:
BSU26670
Details about gltR
Show/Hide
Highest Expression Conditions
HiTm
Diami
dia15
H2O2
G180
LBGexp
G150
G135
dia5
Paraq
10.8
10.6
10.2
10.1
10.1
10.1
10
9.96
9.95
9.94
Lowest Expression Conditions
B60
B36
BT
T0.30H
S6
S5
S7
S4
Pyr
G/S
7.55
7.65
7.66
7.77
7.8
7.9
7.98
8.05
8.08
8.09
Most Positively Correlated Segments
yybE
ycgK
yybD
S113
ydjC
ydfD
ywdF
ytpS
ybgA
yuaC
0.89
0.88
0.87
0.85
0.85
0.84
0.84
0.83
0.83
0.82
Most Negatively Correlated Segments
spoVS
S1112
ytpI
S608
spoIIAB
sigF
spoIIAA
ctaG
S924
ctaF
-0.79
-0.78
-0.78
-0.77
-0.77
-0.77
-0.77
-0.76
-0.76
-0.76
Expression Profile of Segment gltR
Show/Hide
Annotation of Gene gltR
Show/Hide
function
16.3: Control
inference
ab initio prediction:AMIGene:2.0
codon_start
1
product
transcriptional regulator (LysR family)
transl_table
11
note
Evidence 1a: Function experimentally demonstrated in the studied strain; PubMedId: 9023181; Product type r : regulator
db_xref
GI:225185243
protein_id
CAB14608.2
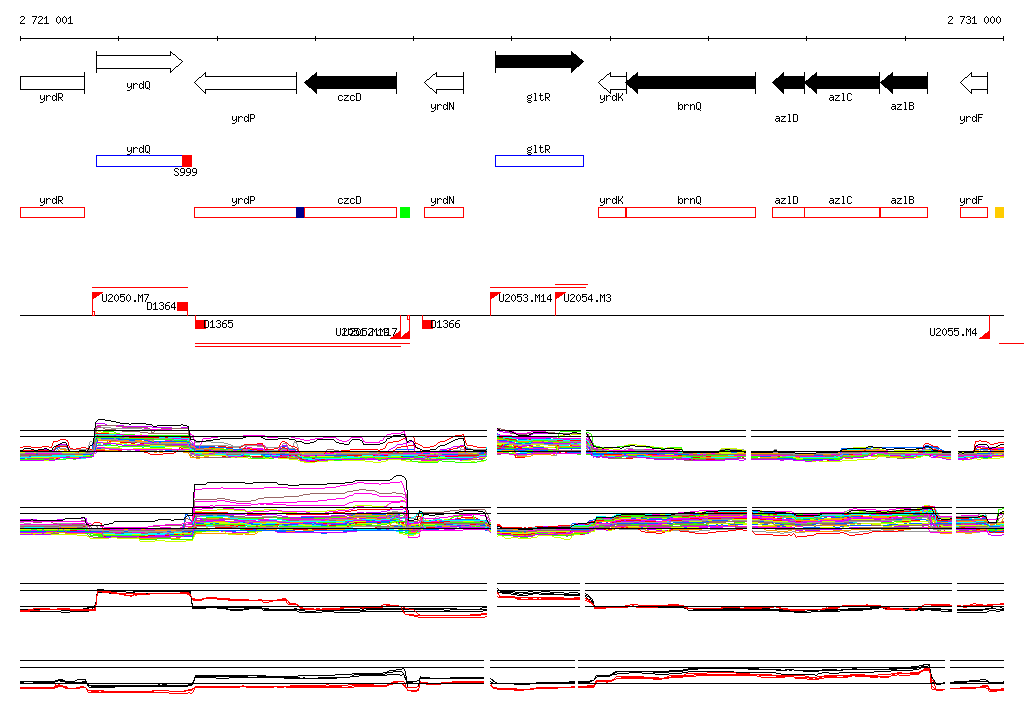
Genomic View of Gene/Segment gltR
Show/Hide
(Legend)
Browse Genome Context