| Start Page |
|
 |
| Start Page |
|
|
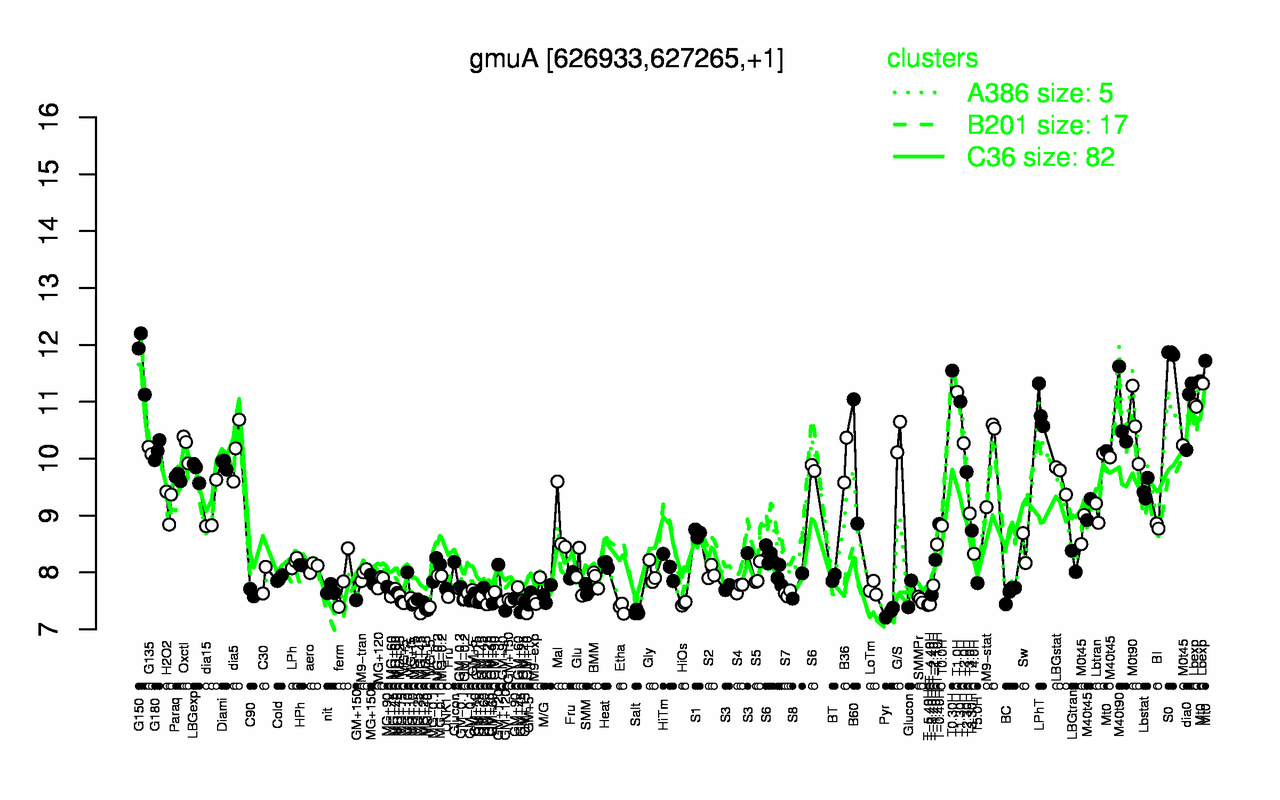
| S0 | G150 | T0.30H | T1.0H | Mt0 | Lbexp | T1.30H | LPhT | dia0 | M40t90 |
| 11.9 | 11.8 | 11.5 | 11.2 | 11.1 | 11.1 | 11 | 10.9 | 10.9 | 10.8 |
| Pyr | Salt | Etha | MG+5 | T-5.40H | T-4.40H | MG+15 | HiOs | GM+10 | GM+25 |
| 7.3 | 7.3 | 7.38 | 7.43 | 7.43 | 7.44 | 7.44 | 7.45 | 7.46 | 7.48 |