| Start Page |
|
 |
| Start Page |
|
|
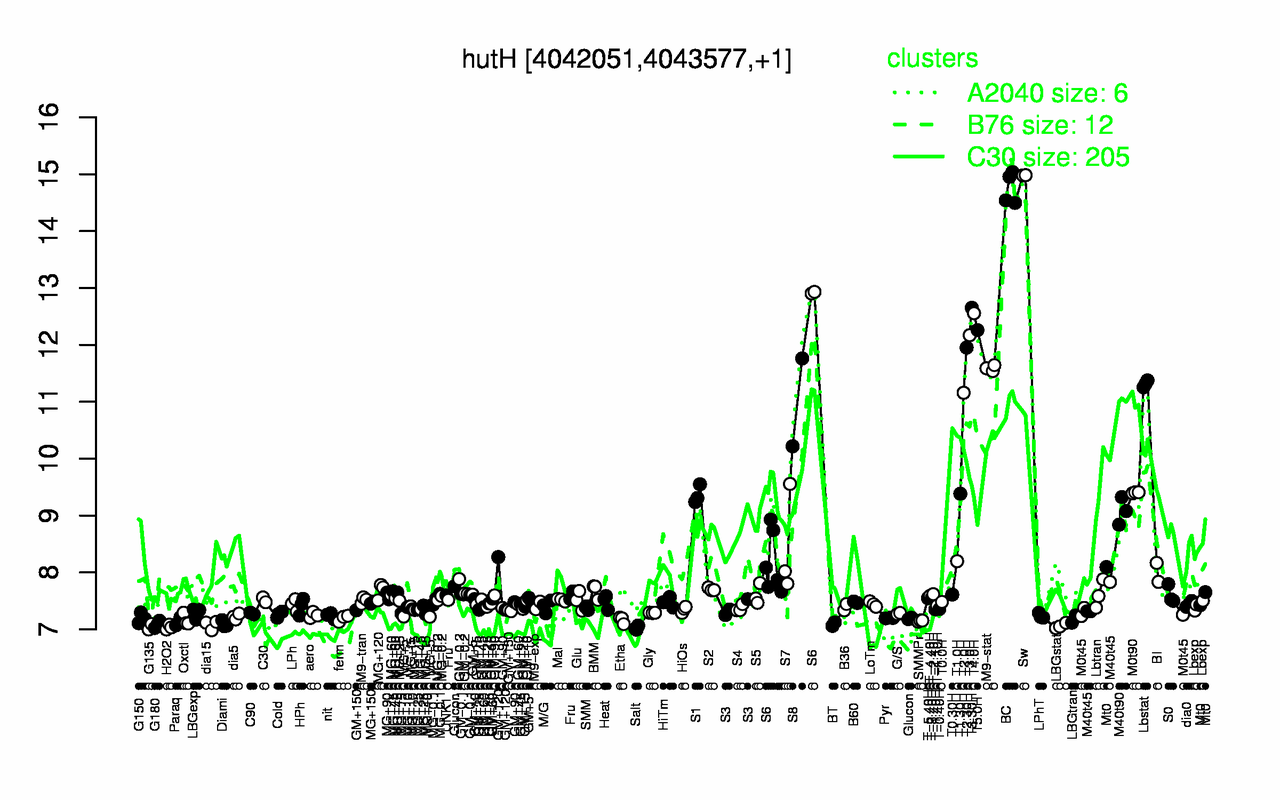
| Sw | BC | T3.30H | T4.0H | T5.0H | T3.0H | T2.30H | M9-stat | Lbstat | T2.0H |
| 15 | 14.8 | 12.7 | 12.6 | 12.3 | 12.2 | 12 | 11.6 | 11.3 | 11.2 |
| Salt | H2O2 | G135 | LBGstat | dia15 | G180 | BT | Diami | Paraq | SMMPr |
| 7.02 | 7.04 | 7.05 | 7.06 | 7.08 | 7.09 | 7.09 | 7.09 | 7.13 | 7.15 |