| Start Page |
|
 |
| Start Page |
|
|
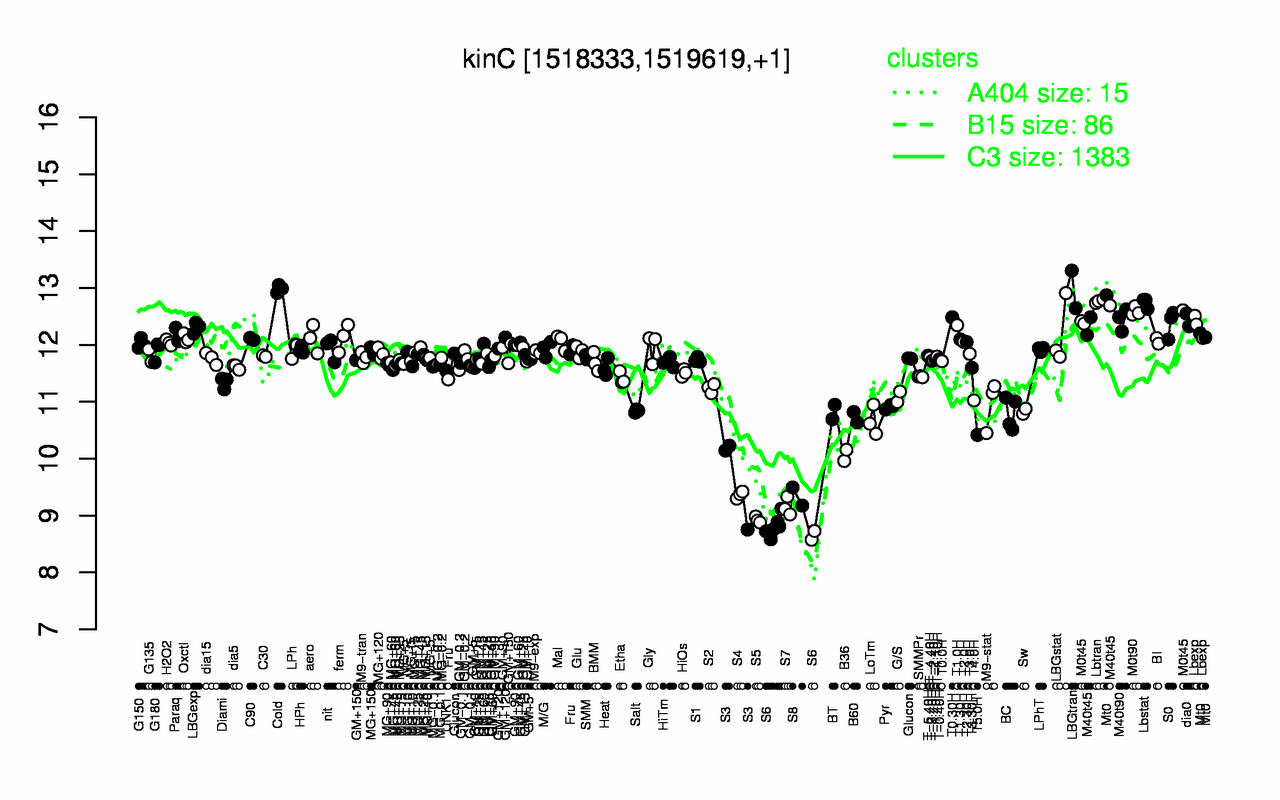
| Cold | LBGtran | Lbtran | Lbstat | M0t90 | T0.30H | M0t45 | M40t45 | M40t90 | dia0 |
| 13 | 13 | 12.8 | 12.7 | 12.6 | 12.5 | 12.5 | 12.5 | 12.4 | 12.4 |
| S6 | S5 | S7 | S8 | S4 | S3 | B36 | T5.0H | LoTm | B60 |
| 8.77 | 8.92 | 9.16 | 9.33 | 9.36 | 9.71 | 10.1 | 10.4 | 10.7 | 10.7 |