B. subtilis Expression Data Browser
Start Page
B. subtilis Expression Data Browser
Gene/Segment:
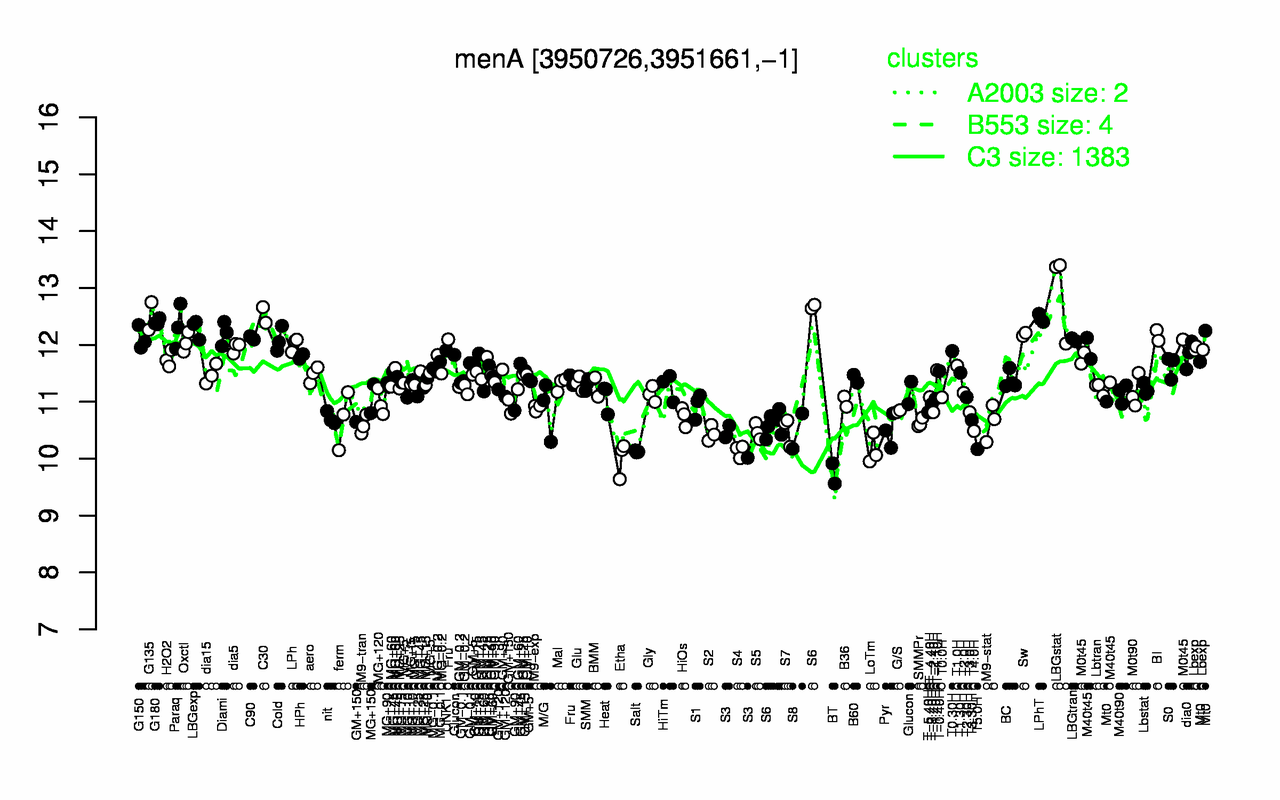
menA
Locus Tag:
BSU38490
Details about menA
Show/Hide
Highest Expression Conditions
LBGstat
C30
G135
LPhT
G180
Paraq
LBGexp
Diami
Sw
BI
12.9
12.5
12.5
12.5
12.4
12.3
12.3
12.2
12.2
12.2
Lowest Expression Conditions
BT
Etha
Salt
S4
LoTm
T5.0H
S3
S2
S5
S8
9.74
10
10.1
10.1
10.2
10.2
10.3
10.4
10.5
10.5
Most Positively Correlated Segments
S1478
ydzS
ydzS
mnaA
yugE
yttB
ysgA
aldX
yfkC
yfkA
0.87
0.77
0.76
0.75
0.75
0.74
0.74
0.74
0.73
0.73
Most Negatively Correlated Segments
rapE
ymzB
S254
sodC
appA
yydF
appA
S566
S404
skfH
-0.71
-0.7
-0.68
-0.68
-0.67
-0.66
-0.66
-0.66
-0.65
-0.65
Expression Profile of Segment menA
Show/Hide
Annotation of Gene menA
Show/Hide
function
16.2: Construct biomass (Anabolism)
function
16.10: Respire
inference
ab initio prediction:AMIGene:2.0
codon_start
1
EC_number
2.5.1.-
transl_table
11
note
Evidence 2a: Function of homologous gene experimentally demonstrated in an other organism; PubMedId: 12682299, 15849754, 16850406, 6780514, 9573170; Product type e: enzyme
db_xref
GI:2636384
product
1,4-dihydroxy-2-naphthoate octaprenyltransferase
protein_id
CAB15875.1
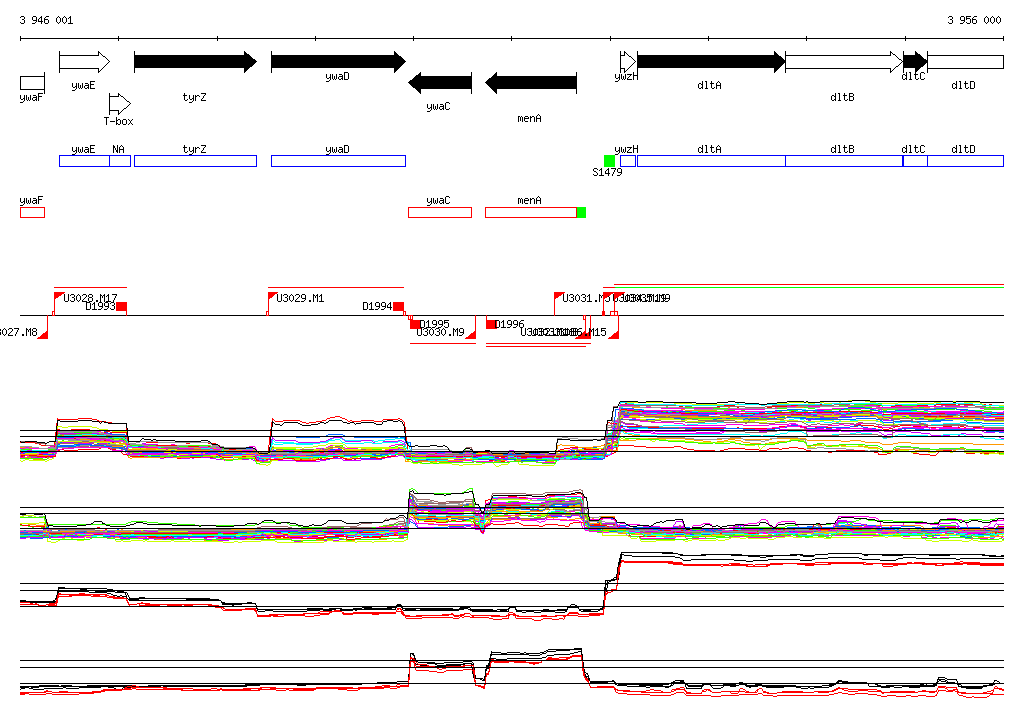
Genomic View of Gene/Segment menA
Show/Hide
(Legend)
Browse Genome Context