B. subtilis Expression Data Browser
Start Page
B. subtilis Expression Data Browser
Gene/Segment:
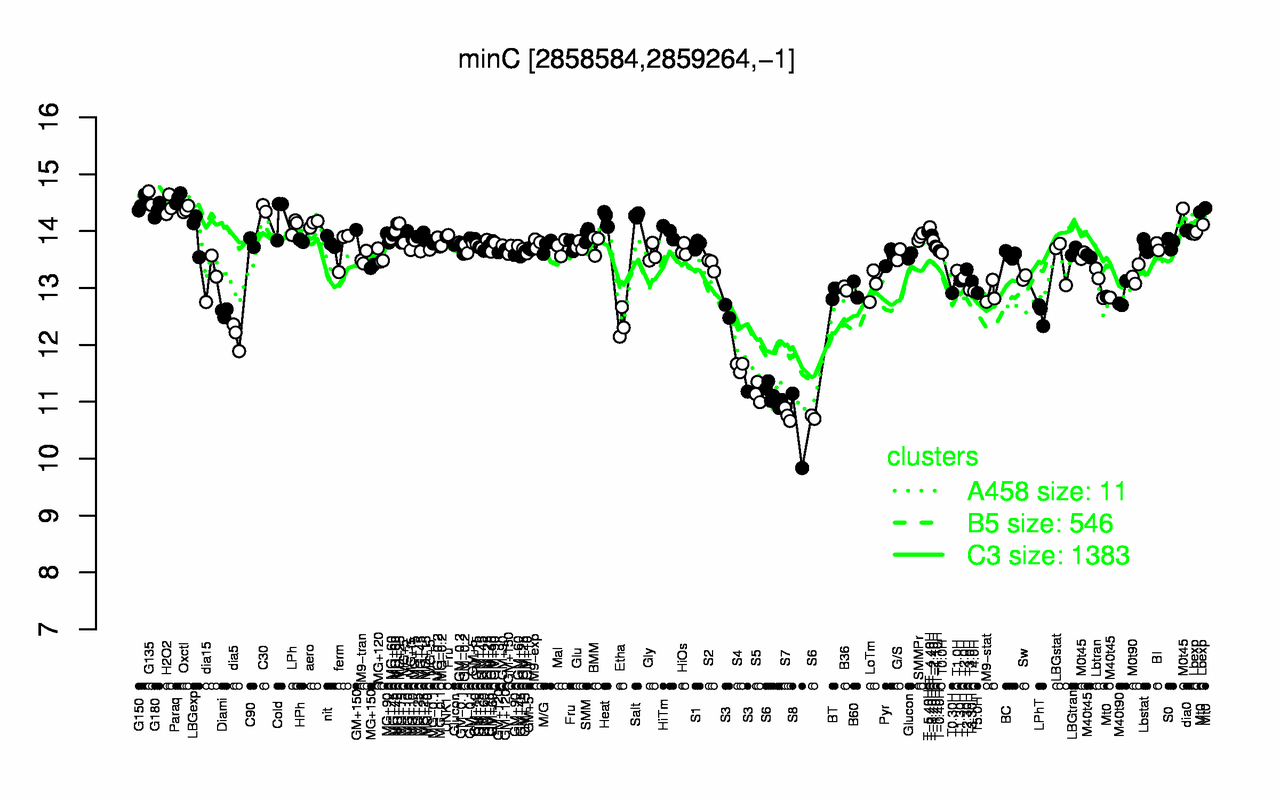
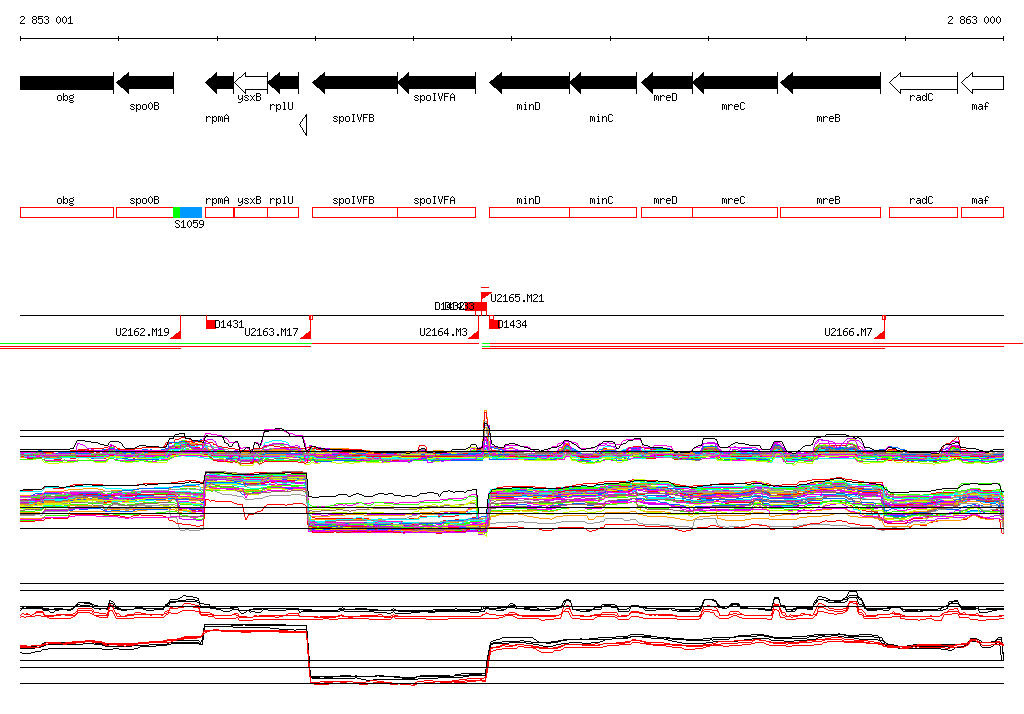
minC
Locus Tag:
BSU28000
Details about minC
Show/Hide
Highest Expression Conditions
Paraq
G135
G150
H2O2
C30
Oxctl
G180
Salt
Cold
Heat
14.6
14.6
14.5
14.4
14.4
14.4
14.4
14.3
14.3
14.2
Lowest Expression Conditions
S8
S7
S6
S5
S4
S3
dia5
Etha
LPhT
Diami
10.5
10.8
11
11.2
11.6
12.1
12.2
12.4
12.6
12.6
Most Positively Correlated Segments
minD
mreD
mreC
asnB
ylxX
oxaAA
ftsE
menH
dltD
ywfO
0.97
0.94
0.92
0.89
0.88
0.88
0.87
0.86
0.86
0.86
Most Negatively Correlated Segments
yycO
ynfE
prpB
yycP
yngE
yngI
yngHA
yozE
yngF
yngG
-0.85
-0.85
-0.84
-0.84
-0.84
-0.84
-0.83
-0.83
-0.83
-0.83
Expression Profile of Segment minC
Show/Hide
Annotation of Gene minC
Show/Hide
function
16.13: Shape
inference
ab initio prediction:AMIGene:2.0
codon_start
1
product
cell-division regulator (septum placement)
transl_table
11
note
Evidence 1a: Function experimentally demonstrated in the studied strain; PubMedId: 10411726, 12426398, 12446561, 15317782, 16322744, 17326815; Product type cp : cell process
db_xref
GI:2635265
protein_id
CAB14760.1
Genomic View of Gene/Segment minC
Show/Hide
(Legend)
Browse Genome Context