| Start Page |
|
 |
| Start Page |
|
|
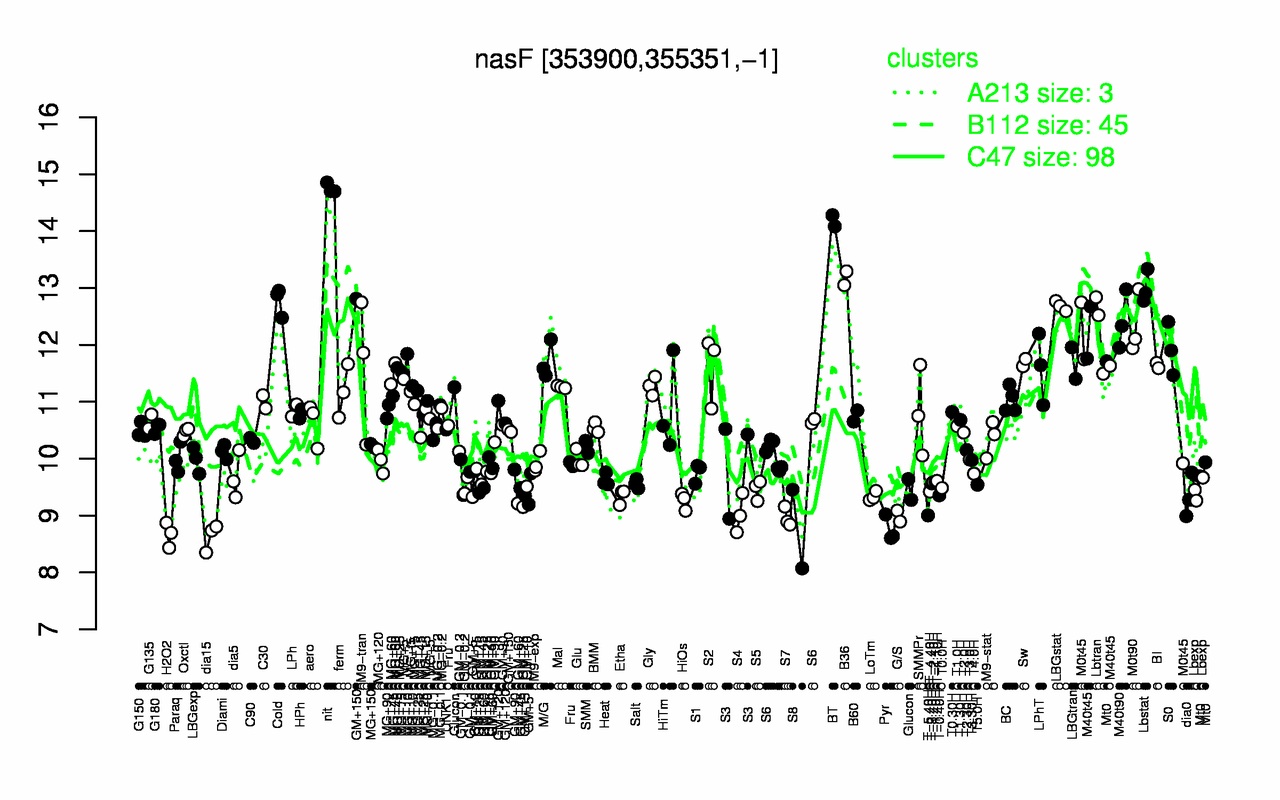
| nit | BT | B36 | Lbstat | Cold | LBGstat | M40t90 | M0t90 | Lbtran | M40t45 |
| 14.8 | 14.2 | 13.2 | 13 | 12.8 | 12.7 | 12.4 | 12.3 | 12.3 | 12 |
| dia15 | H2O2 | Pyr | S8 | S7 | G/S | T-5.40H | S4 | HiOs | LoTm |
| 8.63 | 8.67 | 8.75 | 8.76 | 8.96 | 8.99 | 9 | 9.03 | 9.26 | 9.34 |