B. subtilis Expression Data Browser
Start Page
B. subtilis Expression Data Browser
Gene/Segment:
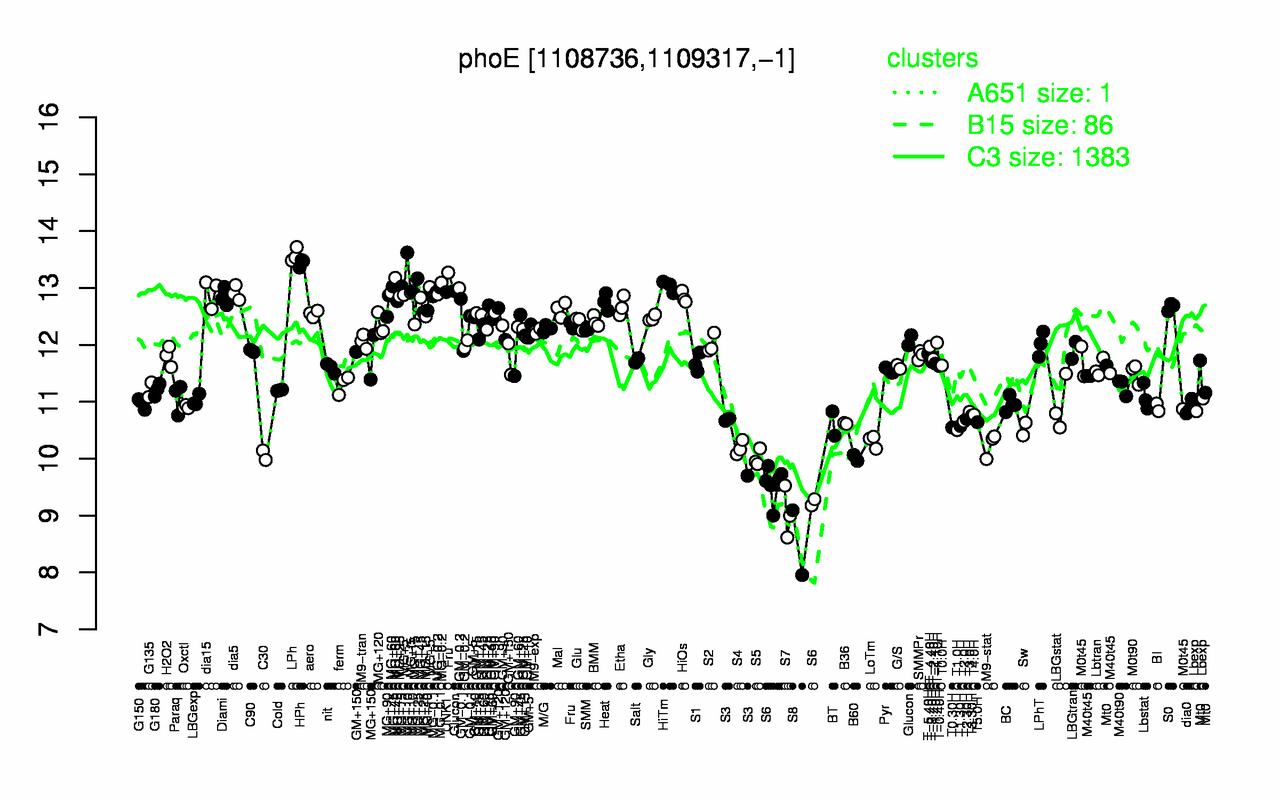
phoE
Locus Tag:
BSU10340
Details about phoE
Show/Hide
Highest Expression Conditions
LPh
HPh
MG+10
MG+60
HiTm
MG-0.2
MG+5
MG-0.1
UNK1
dia15
13.6
13.4
13.1
13
13
13
12.9
12.9
12.9
12.9
Lowest Expression Conditions
S8
S7
S6
S5
B60
C30
S4
M9-stat
LoTm
S3
8.52
9.05
9.49
10
10
10.1
10.2
10.2
10.3
10.4
Most Positively Correlated Segments
purT
yhdR
yhfT
yhfS
glyA
yueD
kapB
penP
yqhM
lytB
0.85
0.82
0.81
0.8
0.8
0.78
0.78
0.77
0.77
0.76
Most Negatively Correlated Segments
S609
S831
yhaX
ywcA
ywcB
S201
yteV
sqhC
yxjF
ylaJ
-0.78
-0.78
-0.77
-0.77
-0.76
-0.76
-0.75
-0.75
-0.75
-0.75
Expression Profile of Segment phoE
Show/Hide
Annotation of Gene phoE
Show/Hide
function
16.11: Scavenge (Catabolism)
inference
ab initio prediction:AMIGene:2.0
codon_start
1
product
phosphatase
transl_table
11
note
Evidence 1a: Function experimentally demonstrated in the studied strain; PubMedId: 10869096, 11827481, 17693564; Product type e: enzyme
db_xref
GI:2633370
protein_id
CAB12874.1
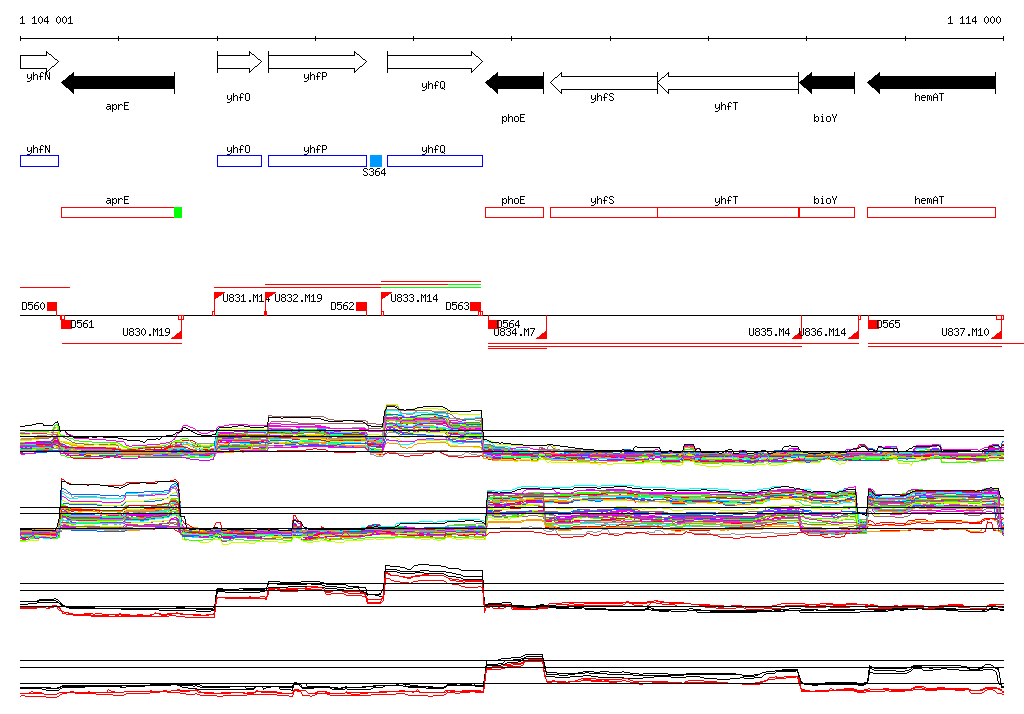
Genomic View of Gene/Segment phoE
Show/Hide
(Legend)
Browse Genome Context