| Start Page |
|
 |
| Start Page |
|
|
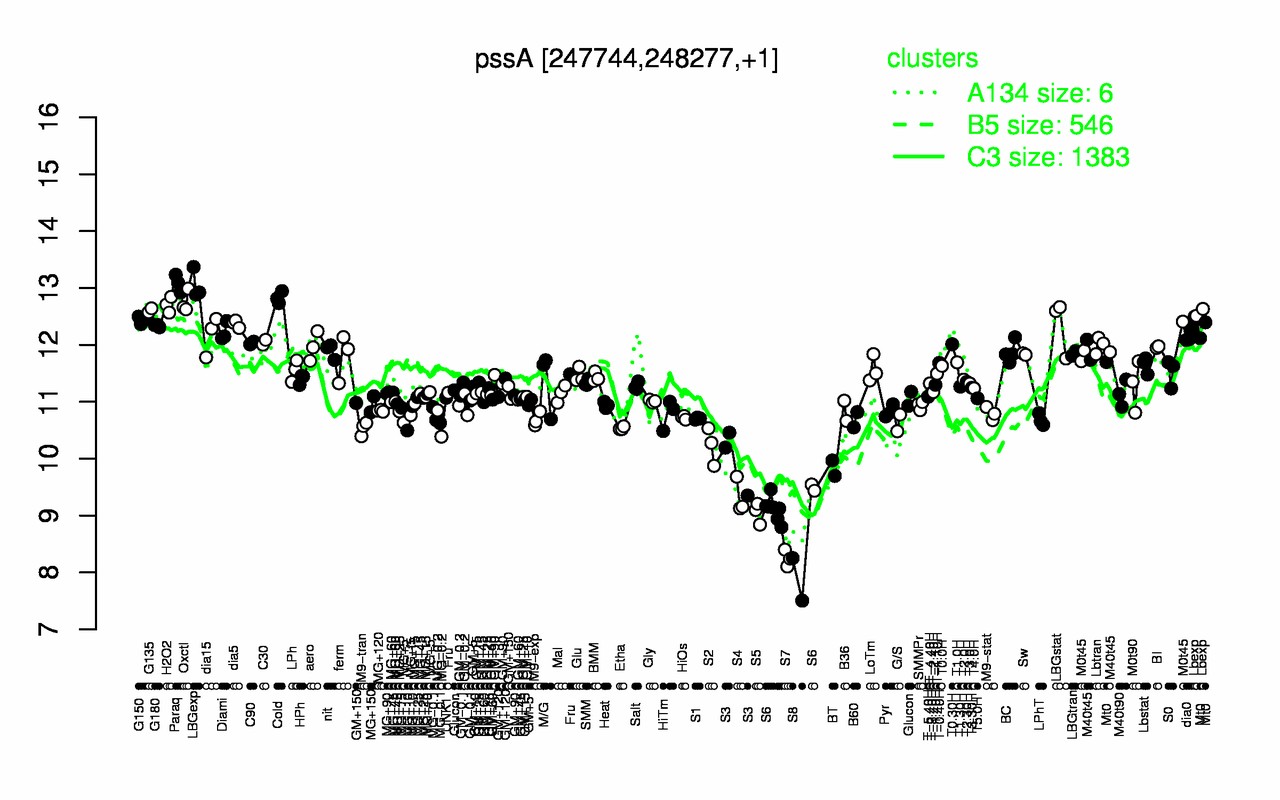
| Paraq | LBGexp | Cold | Oxctl | H2O2 | G135 | Lbexp | G150 | dia5 | LBGstat |
| 13.1 | 13.1 | 12.8 | 12.8 | 12.7 | 12.6 | 12.5 | 12.4 | 12.4 | 12.3 |
| S8 | S7 | S5 | S6 | S4 | BT | S3 | S2 | M9-tran | Etha |
| 7.88 | 8.25 | 9.05 | 9.2 | 9.32 | 9.83 | 10 | 10.2 | 10.5 | 10.5 |