| Start Page |
|
 |
| Start Page |
|
|
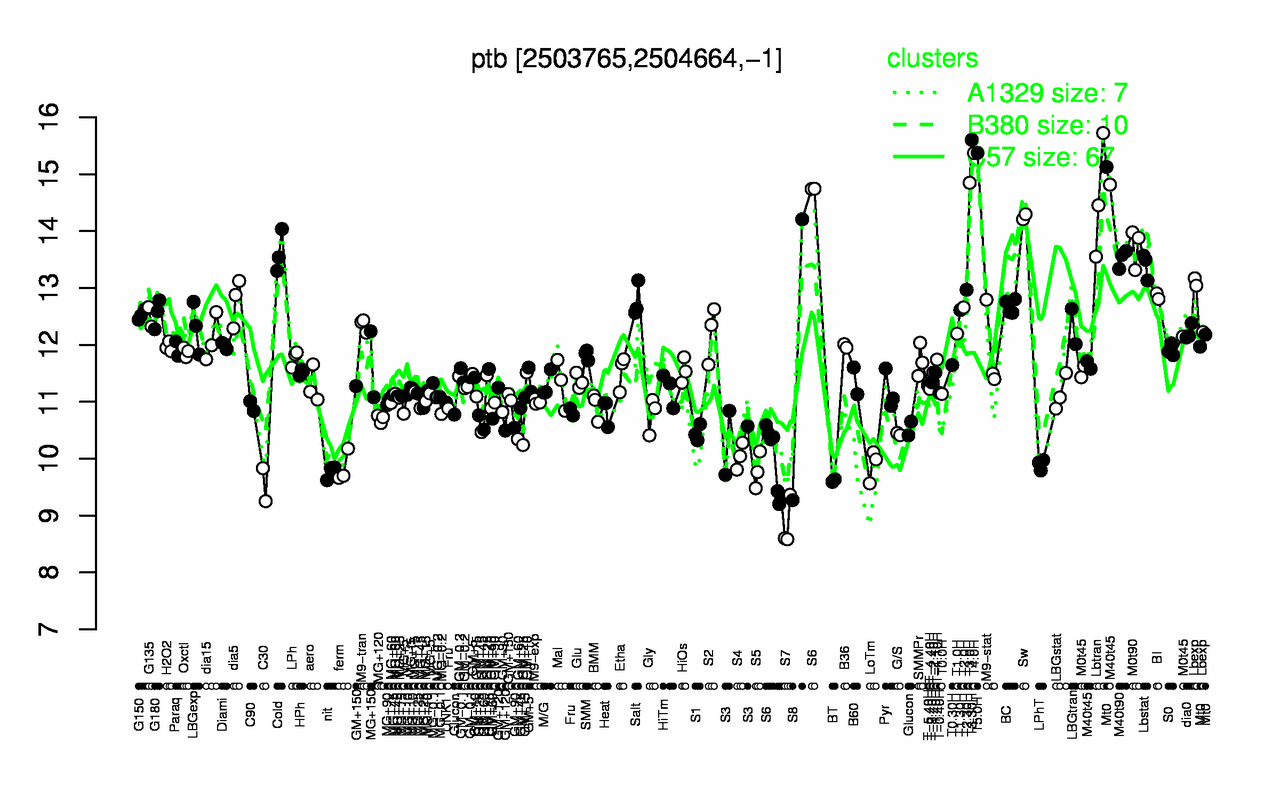
| T3.30H | T5.0H | T4.0H | T3.0H | Lbtran | Sw | M0t90 | Cold | M40t90 | Lbstat |
| 15.6 | 15.4 | 15.4 | 14.8 | 14.6 | 14.3 | 13.7 | 13.6 | 13.5 | 13.4 |
| S7 | C30 | BT | nit | S5 | ferm | LoTm | LPhT | S4 | S3 |
| 8.85 | 9.54 | 9.61 | 9.77 | 9.79 | 9.85 | 9.89 | 9.9 | 10 | 10.4 |