B. subtilis Expression Data Browser
Start Page
B. subtilis Expression Data Browser
Gene/Segment:
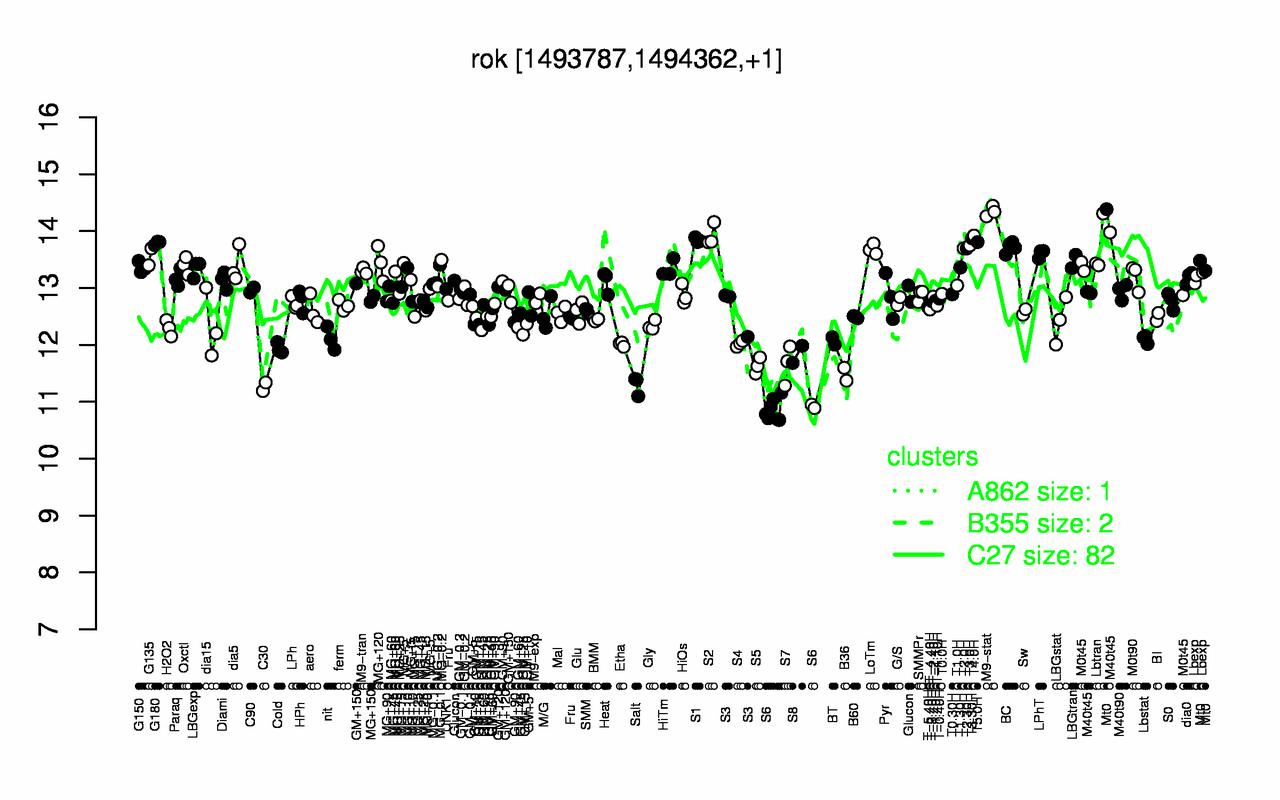
rok
Locus Tag:
BSU14240
Details about rok
Show/Hide
Highest Expression Conditions
M9-stat
S2
T4.0H
T3.30H
S1
T5.0H
G180
T3.0H
Mt0
BC
14.3
13.9
13.9
13.9
13.8
13.8
13.8
13.7
13.7
13.7
Lowest Expression Conditions
S6
C30
Salt
B36
S5
S7
S8
Cold
Etha
S4
10.9
11.3
11.3
11.5
11.6
11.7
11.8
11.9
12
12
Most Positively Correlated Segments
degU
ybaJ
yfjP
cheR
dctB
parA
yoeC
ydhH
parB
S277
0.66
0.65
0.64
0.64
0.64
0.64
0.63
0.63
0.63
0.63
Most Negatively Correlated Segments
yhfA
S425
S1396
S147
S1433
S873
yhdB
ykoU
S984
yoyG
-0.67
-0.66
-0.66
-0.65
-0.64
-0.64
-0.64
-0.64
-0.63
-0.63
Expression Profile of Segment rok
Show/Hide
Annotation of Gene rok
Show/Hide
function
16.3: Control
inference
ab initio prediction:AMIGene:2.0
codon_start
1
product
repressor of comK
transl_table
11
note
Evidence 1a: Function experimentally demonstrated in the studied strain; PubMedId: 15743949, 15819619; Product type r: regulator
db_xref
GI:2633795
protein_id
CAB13297.1
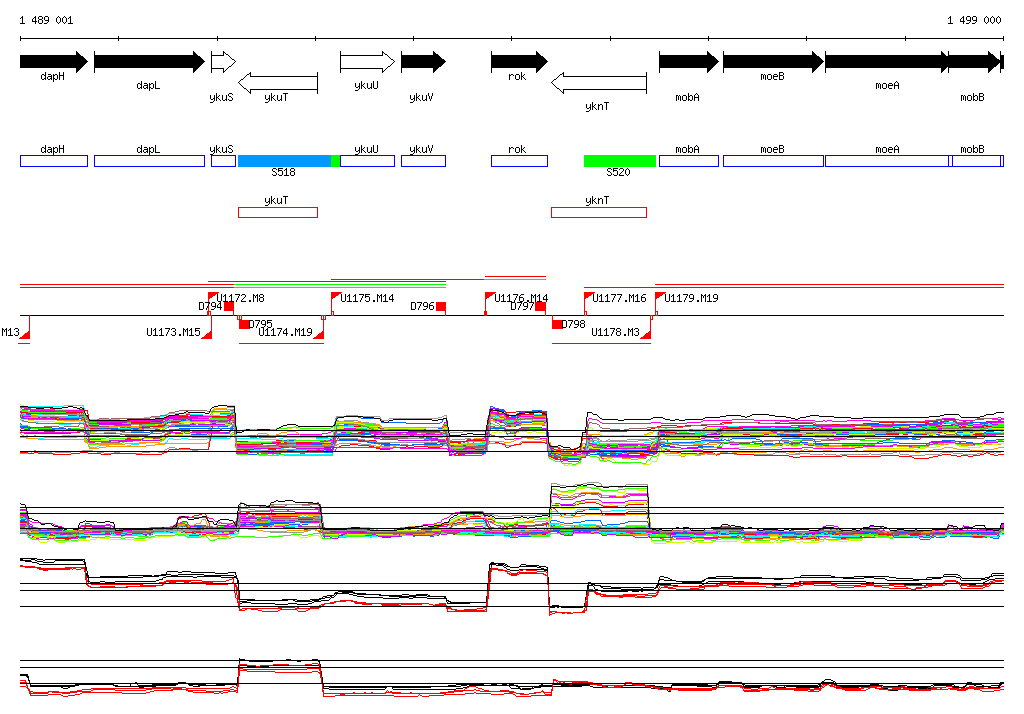
Genomic View of Gene/Segment rok
Show/Hide
(Legend)
Browse Genome Context