| Start Page |
|
 |
| Start Page |
|
|
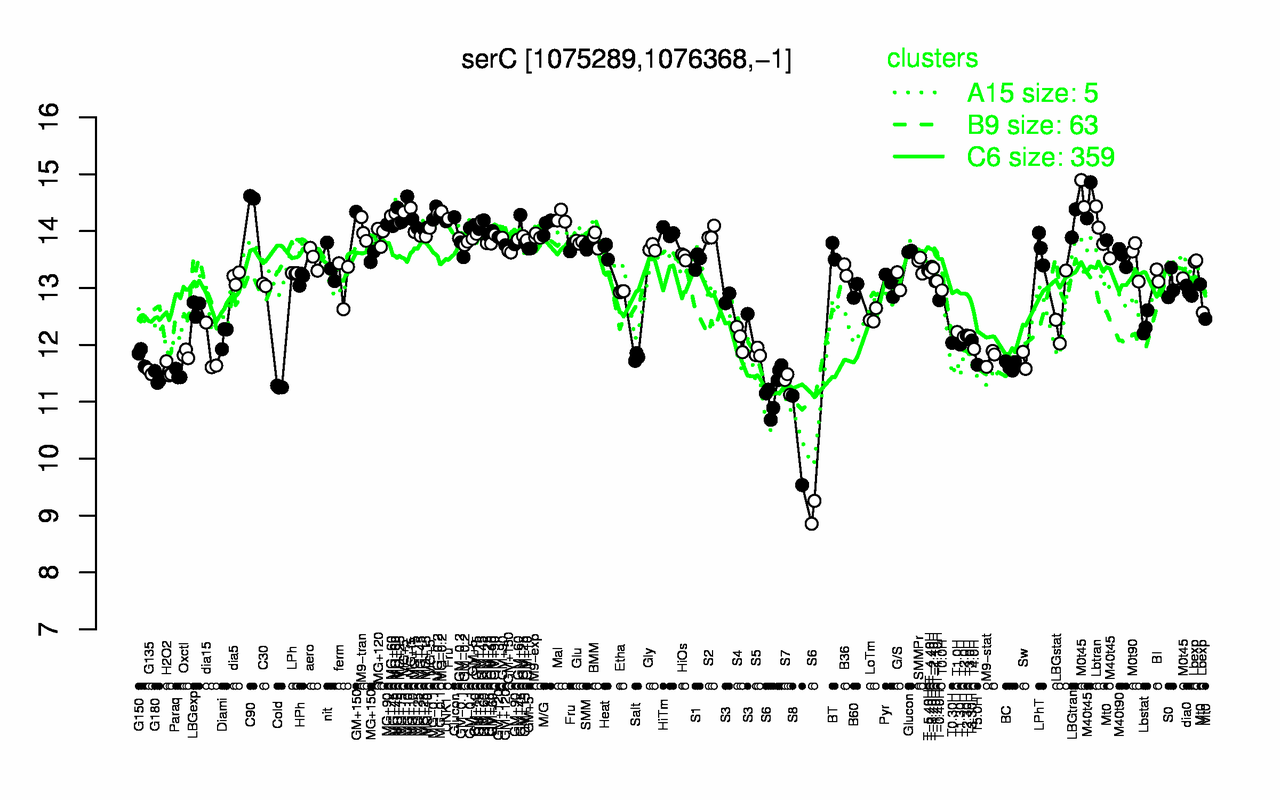
| C90 | MG+t5 | MG-0.2 | MG-0.1 | MG+10 | MG+60 | Mal | M40t45 | MG+5 | UNK1 |
| 14.6 | 14.4 | 14.3 | 14.3 | 14.3 | 14.3 | 14.2 | 14.2 | 14.2 | 14.2 |
| S8 | S6 | Cold | S7 | G180 | Paraq | G135 | H2O2 | BC | T5.0H |
| 10.3 | 10.7 | 11.3 | 11.3 | 11.4 | 11.5 | 11.5 | 11.6 | 11.6 | 11.6 |