B. subtilis Expression Data Browser
Start Page
B. subtilis Expression Data Browser
Gene/Segment:
spmA
Locus Tag:
BSU23180
Details about spmA
Show/Hide
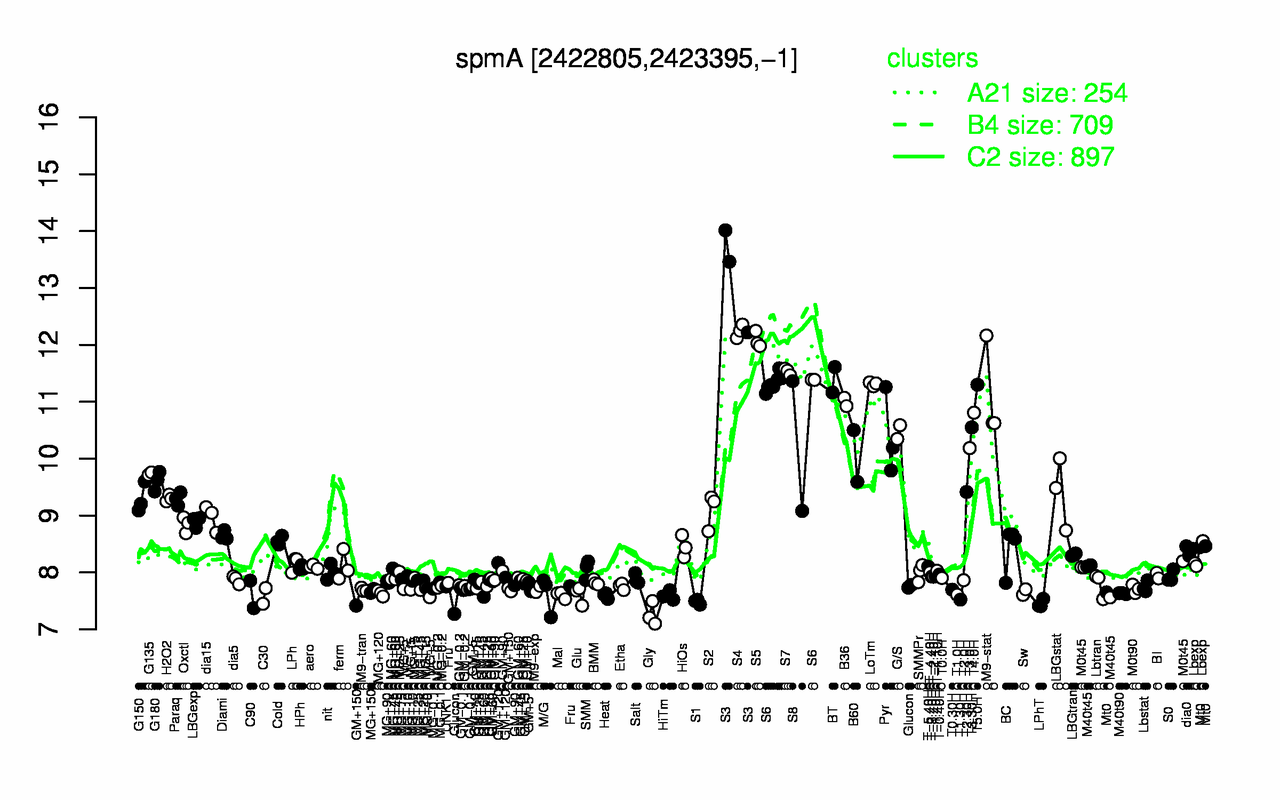
Highest Expression Conditions
S3
S4
S5
S7
BT
S6
LoTm
T5.0H
M9-stat
B36
13.2
12.2
12.1
11.5
11.4
11.3
11.3
11.3
11.1
11
Lowest Expression Conditions
Gly
LPhT
S1
T1.30H
C30
Heat
HiTm
Glucon
Mal
GM+150
7.27
7.45
7.48
7.52
7.59
7.59
7.59
7.6
7.6
7.6
Most Positively Correlated Segments
spmB
dacB
spoIVFA
spoVD
spoIVFB
yhaL
S493
S162
yugT
gerM
0.99
0.99
0.98
0.97
0.97
0.95
0.94
0.94
0.94
0.94
Most Negatively Correlated Segments
sigD
cheC
cheD
cheW
flhA
cheA
flhF
ybeC
fliM
yceH
-0.85
-0.83
-0.83
-0.83
-0.81
-0.81
-0.8
-0.8
-0.8
-0.8
Expression Profile of Segment spmA
Show/Hide
Annotation of Gene spmA
Show/Hide
function
16.8: Protect
function
16.5: Explore
inference
ab initio prediction:AMIGene:2.0
codon_start
1
product
spore maturation protein
transl_table
11
note
Evidence 1a: Function experimentally demonstrated in the studied strain; PubMedId: 15849754, 16850406, 7642500; Product type cp: cell process
db_xref
GI:2634753
protein_id
CAB14250.1
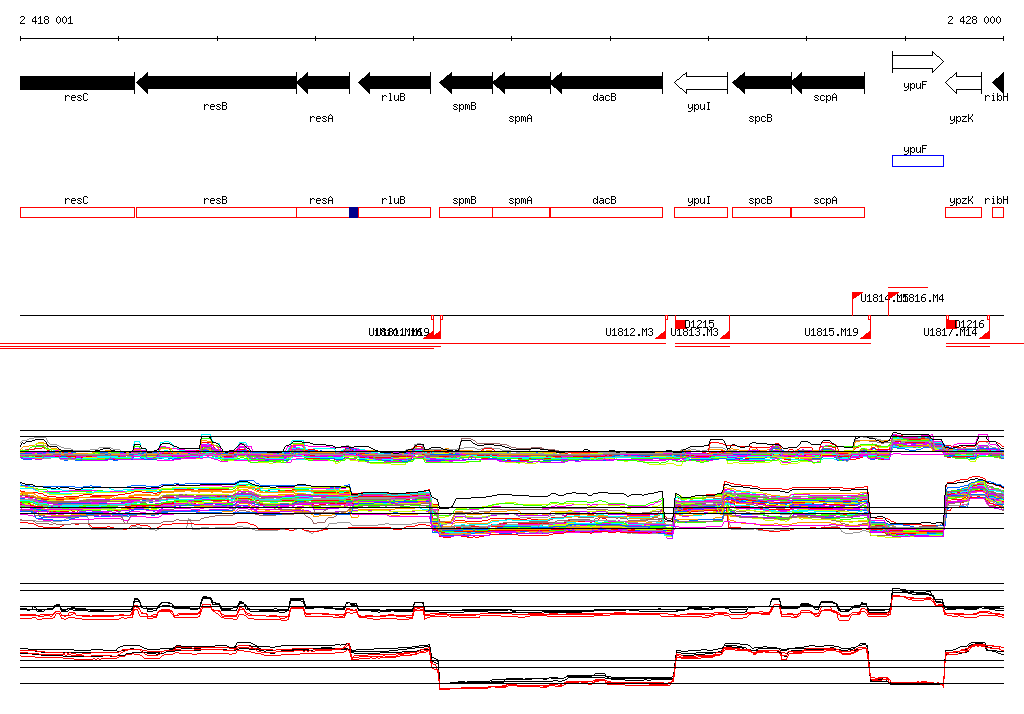
Genomic View of Gene/Segment spmA
Show/Hide
(Legend)
Browse Genome Context