| Start Page |
|
 |
| Start Page |
|
|
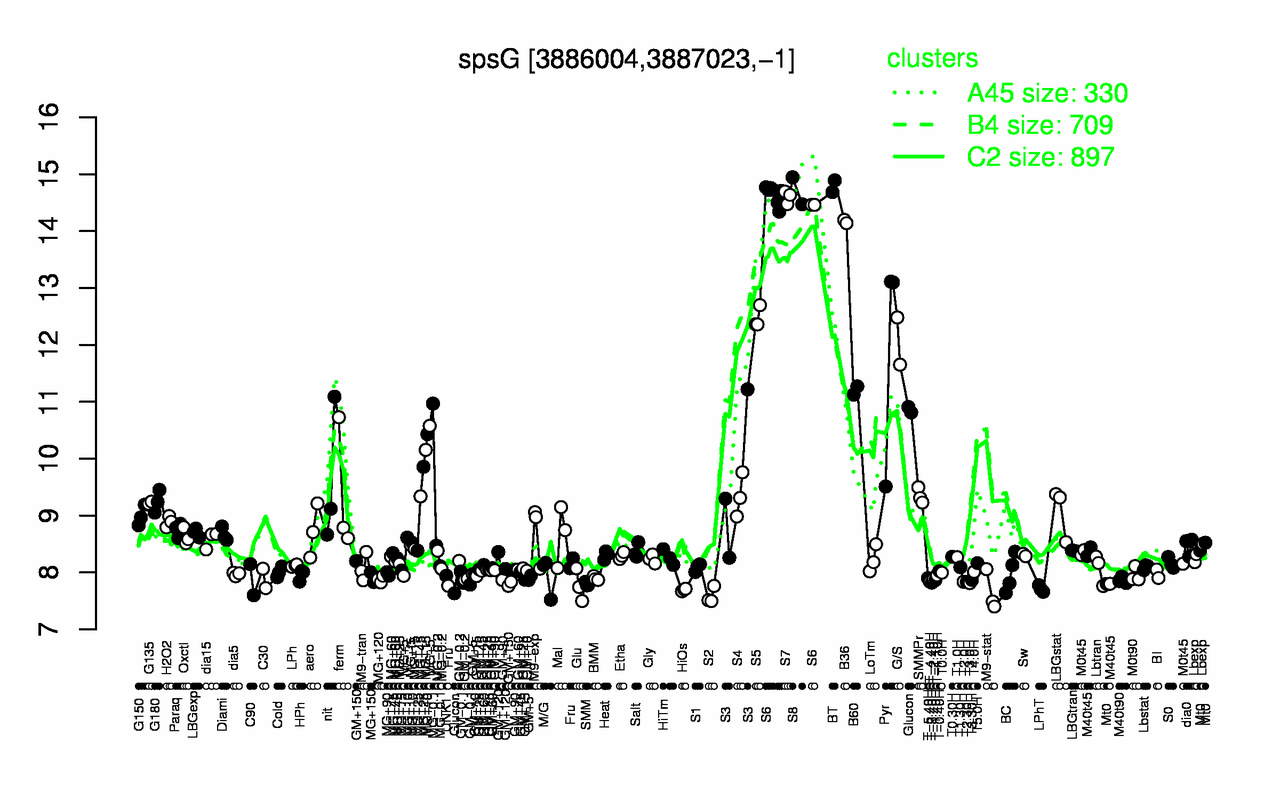
| BT | S8 | S6 | S7 | B36 | S5 | G/S | Pyr | B60 | Glucon |
| 14.8 | 14.7 | 14.6 | 14.6 | 14.2 | 12.5 | 12.1 | 11.9 | 11.2 | 9.78 |
| S2 | M9-stat | HiOs | LPhT | Glu | SMM | T3.0H | T-3.40H | T2.30H | T2.0H |
| 7.59 | 7.65 | 7.69 | 7.71 | 7.77 | 7.8 | 7.81 | 7.82 | 7.83 | 7.84 |