B. subtilis Expression Data Browser
Start Page
B. subtilis Expression Data Browser
Gene/Segment:
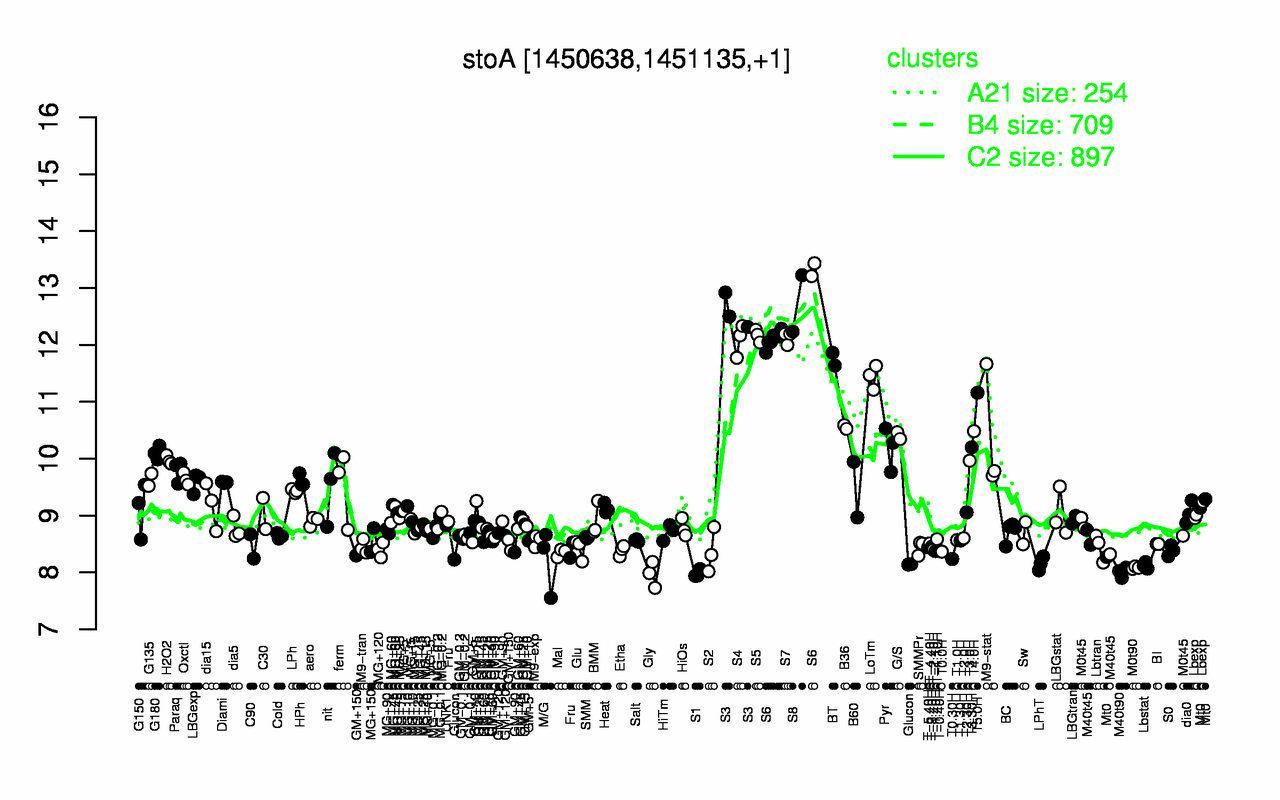
stoA
Locus Tag:
BSU13840
Details about stoA
Show/Hide
Highest Expression Conditions
S8
S3
S6
S5
S7
S4
BT
LoTm
T5.0H
B36
12.7
12.6
12.4
12.2
12.1
12.1
11.7
11.4
11.2
10.6
Lowest Expression Conditions
Gly
S1
M40t90
M0t90
Lbstat
LPhT
Glucon
M/G
T0.30H
Mal
7.97
7.98
8
8.08
8.12
8.16
8.17
8.22
8.24
8.35
Most Positively Correlated Segments
yugT
yhbB
yjaV
ydhD
S624
nucB
S731
spoVK
spmB
S111
0.94
0.94
0.94
0.93
0.93
0.93
0.92
0.92
0.92
0.92
Most Negatively Correlated Segments
sigD
addB
yceG
yugH
yydB
addA
flgB
yydC
yceH
flgC
-0.85
-0.82
-0.82
-0.82
-0.82
-0.82
-0.81
-0.81
-0.81
-0.81
Expression Profile of Segment stoA
Show/Hide
Annotation of Gene stoA
Show/Hide
function
16.13: Shape
inference
ab initio prediction:AMIGene:2.0
codon_start
1
product
thiol-disulfide isomerase
transl_table
11
note
Evidence 1a: Function experimentally demonstrated in the studied strain; PubMedId: 15322369, 15342593; Product type e: enzyme
db_xref
GI:2633755
protein_id
CAB13257.1
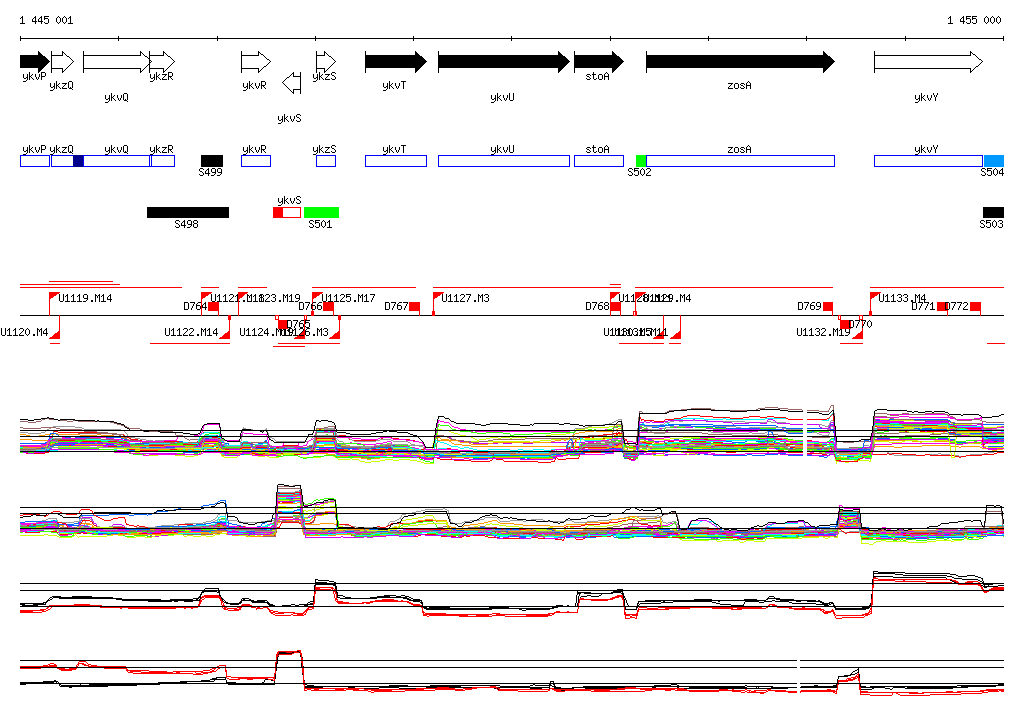
Genomic View of Gene/Segment stoA
Show/Hide
(Legend)
Browse Genome Context