B. subtilis Expression Data Browser
Start Page
B. subtilis Expression Data Browser
Gene/Segment:
tgl
Locus Tag:
BSU31270
Details about tgl
Show/Hide
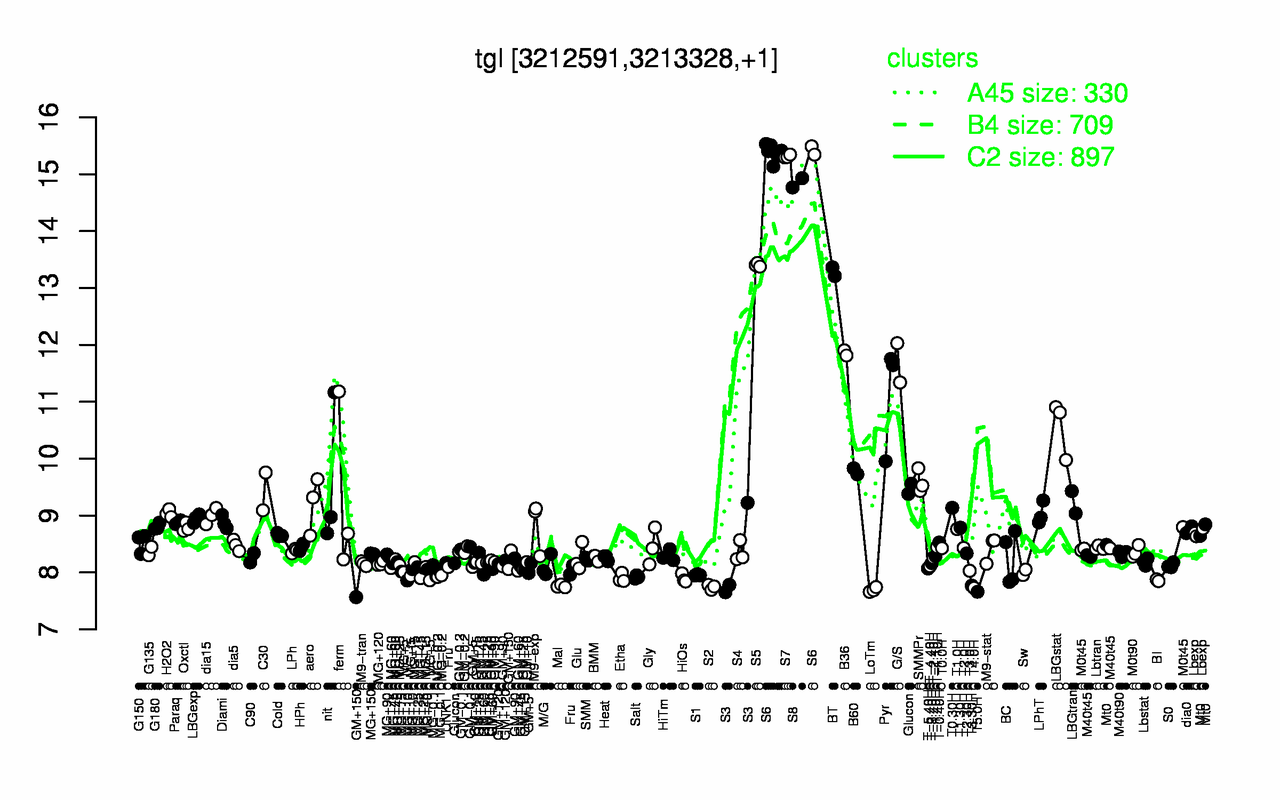
Highest Expression Conditions
S6
S7
S8
S5
BT
B36
G/S
Pyr
LBGstat
B60
15.4
15.3
14.8
13.4
13.3
11.9
11.7
11.1
10.6
9.78
Lowest Expression Conditions
T5.0H
LoTm
T4.0H
S2
Mal
T3.30H
BI
HiOs
Etha
Salt
7.66
7.7
7.73
7.74
7.76
7.77
7.86
7.9
7.9
7.92
Most Positively Correlated Segments
cdoA
S81
yitD
yqcI
cotP
S195
S698
ydgA
ydgB
ylbE
0.97
0.97
0.97
0.97
0.97
0.97
0.97
0.97
0.97
0.96
Most Negatively Correlated Segments
ykuH
S511
penP
ptkA
cheR
bceR
S1355
parA
dtd
degU
-0.8
-0.8
-0.79
-0.79
-0.79
-0.79
-0.79
-0.79
-0.78
-0.78
Expression Profile of Segment tgl
Show/Hide
Annotation of Gene tgl
Show/Hide
function
16.5: Explore
function
16.13: Shape
inference
ab initio prediction:AMIGene:2.0
codon_start
1
EC_number
2.3.2.13
transl_table
11
note
Evidence 1a: Function experimentally demonstrated in the studied strain; PubMedId: 16267299, 16751597, 16936016, 18249137, 9692191; Product type e: enzyme
db_xref
GI:2635611
product
protein-glutamine gamma-glutamyltransferase (transglutaminase)
protein_id
CAB15105.1
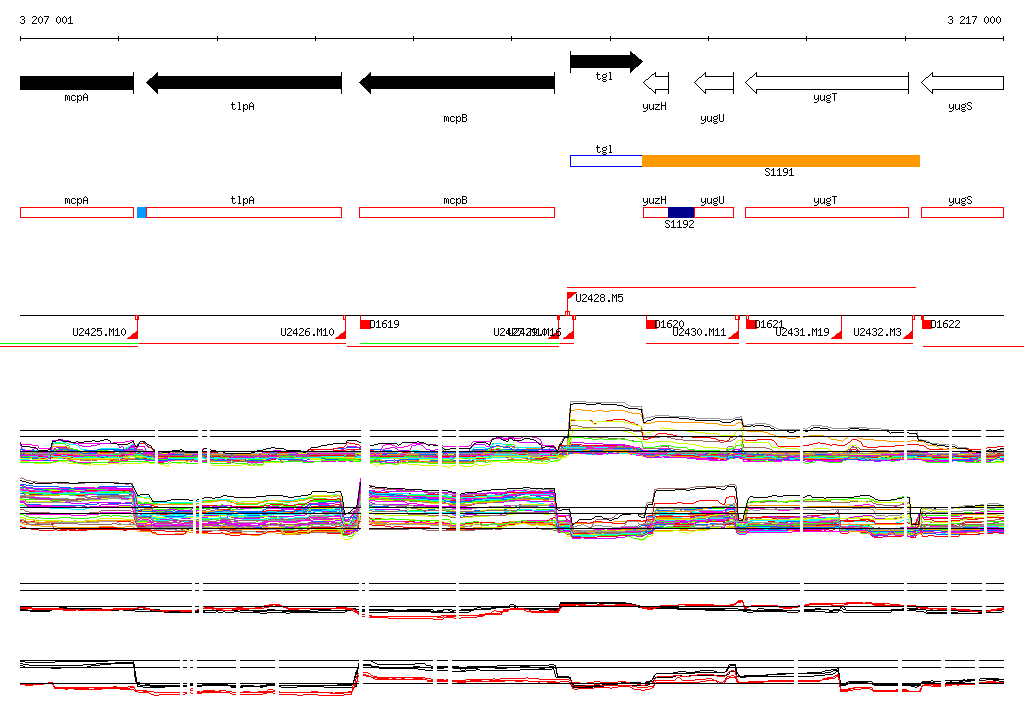
Genomic View of Gene/Segment tgl
Show/Hide
(Legend)
Browse Genome Context