B. subtilis Expression Data Browser
Details about thrS Show/Hide
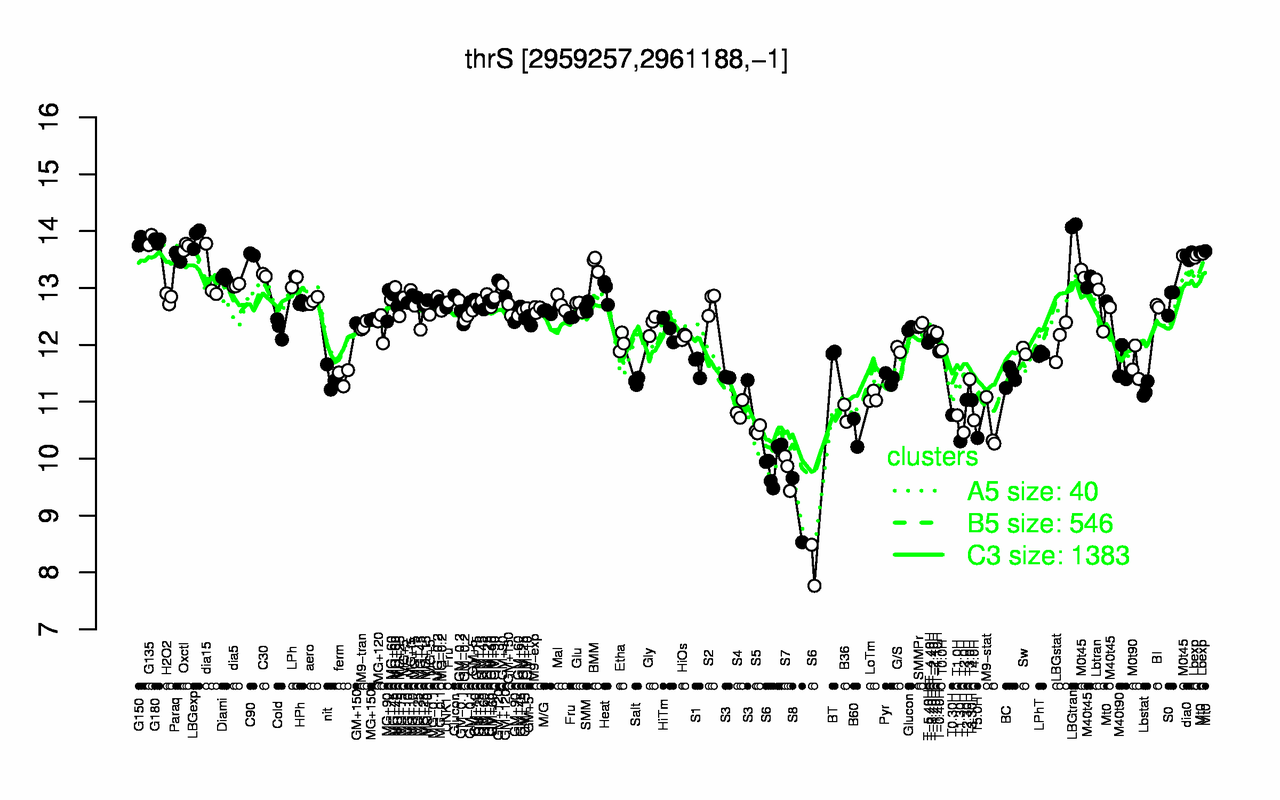
Highest Expression Conditions
LBGtran LBGexp G135 G180 G150 Oxctl C90 Lbexp dia0 Paraq
14.1 13.9 13.8 13.8 13.8 13.7 13.6 13.6 13.6 13.5
Lowest Expression Conditions
S8 S6 S7 T1.30H T5.0H B60 T2.0H S5 M9-stat T4.0H
9.09 9.54 9.78 10.3 10.4 10.5 10.5 10.5 10.6 10.7
Most Positively Correlated Segments
fabL leuS mscL gatB yhcI gatA glyS yhcH smc yybG
0.94 0.91 0.91 0.91 0.91 0.9 0.9 0.89 0.89 0.89
Most Negatively Correlated Segments
S738 yoyB ybbC yhzD yycO yngHA ybbD yngG yngHB mpr
-0.85 -0.84 -0.83 -0.83 -0.83 -0.82 -0.82 -0.82 -0.82 -0.82
Expression Profile of Segment thrS Show/Hide
Annotation of Gene thrS Show/Hide
function
16.2: Construct biomass (Anabolism)
inference
ab initio prediction:AMIGene:2.0
codon_start
1
EC_number
6.1.1.3
transl_table
11
note
Evidence 1a: Function experimentally demonstrated in the studied strain; PubMedId: 10632708, 15831787, 8692931, 9826762; Product type e: enzyme
db_xref
GI:2635360
product
threonyl-tRNA synthetase
protein_id
CAB14855.1
Genomic View of Gene/Segment thrS Show/Hide
(Legend)