B. subtilis Expression Data Browser
Start Page
B. subtilis Expression Data Browser
Gene/Segment:
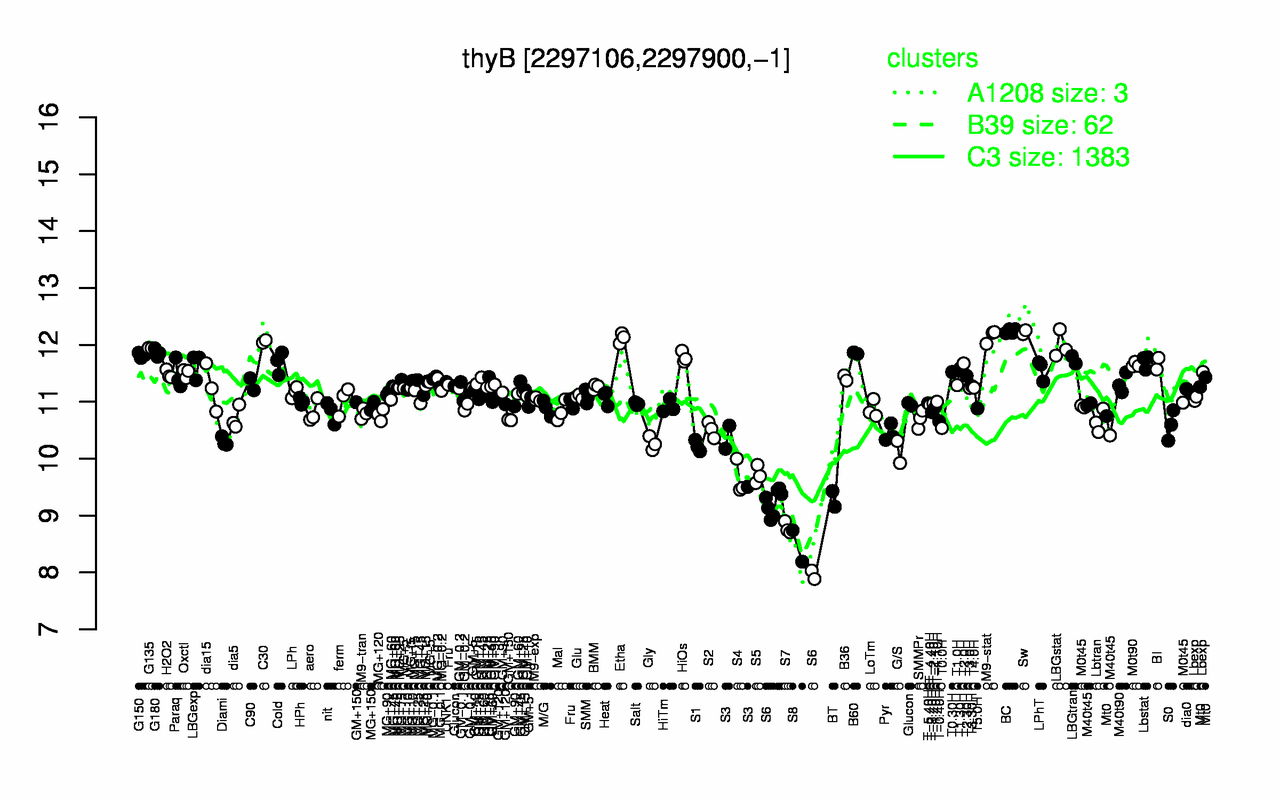
thyB
Locus Tag:
BSU21820
Details about thyB
Show/Hide
Highest Expression Conditions
BC
Sw
M9-stat
Etha
C30
LBGstat
G135
G180
B60
G150
12.2
12.2
12.2
12.1
12.1
12
11.9
11.9
11.9
11.8
Lowest Expression Conditions
S8
S7
S6
BT
S4
S5
S3
G/S
S1
Gly
8.46
8.78
8.95
9.29
9.65
9.72
10.1
10.1
10.2
10.3
Most Positively Correlated Segments
dfrA
ypkP
dnaB
aroC
secA
pabC
recG
yfjP
rnhC
dnaD
0.94
0.91
0.86
0.82
0.81
0.81
0.8
0.8
0.8
0.8
Most Negatively Correlated Segments
S1177
yrrI
S1178
ypbQ
S477
ytdA
bcsA
ykoP
S984
yhjR
-0.77
-0.77
-0.77
-0.77
-0.77
-0.76
-0.76
-0.76
-0.75
-0.75
Expression Profile of Segment thyB
Show/Hide
Annotation of Gene thyB
Show/Hide
function
16.2: Construct biomass (Anabolism)
inference
ab initio prediction:AMIGene:2.0
codon_start
1
EC_number
2.1.1.45
transl_table
11
note
Evidence 1a: Function experimentally demonstrated in the studied strain; PubMedId: 10574451, 9648749; Product type e: enzyme
db_xref
GI:2634602
product
thymidylate synthase B
protein_id
CAB14100.1
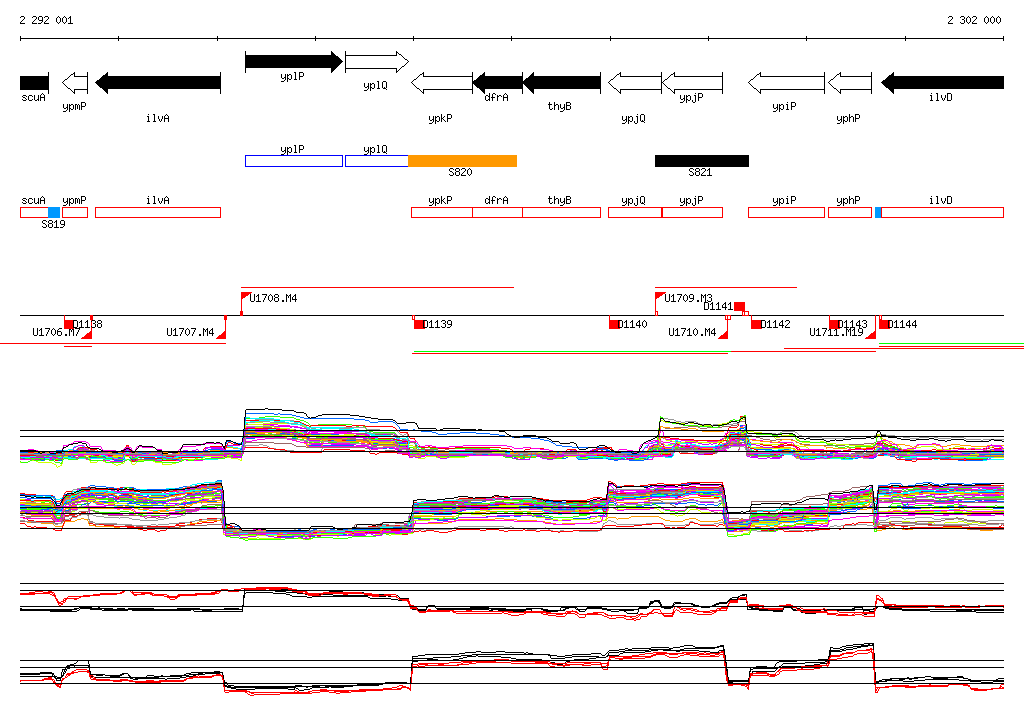
Genomic View of Gene/Segment thyB
Show/Hide
(Legend)
Browse Genome Context