| Start Page |
|
 |
| Start Page |
|
|
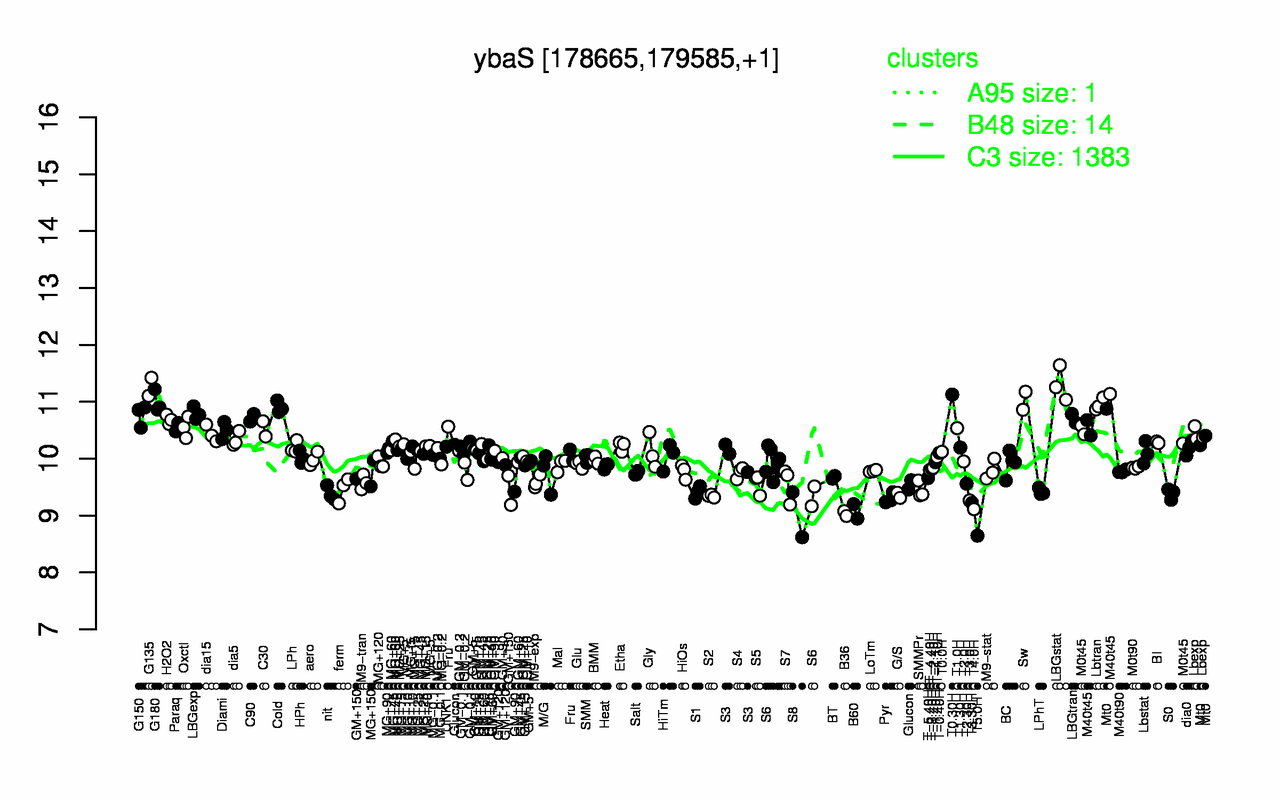
| LBGstat | G135 | T0.30H | Sw | G180 | Lbtran | Cold | LBGexp | G150 | M40t45 |
| 11.3 | 11.3 | 11.1 | 11 | 11 | 11 | 10.9 | 10.8 | 10.8 | 10.7 |
| T5.0H | S8 | B36 | B60 | T4.0H | T3.30H | T3.0H | Pyr | S2 | G/S |
| 8.65 | 9.02 | 9.04 | 9.07 | 9.11 | 9.22 | 9.27 | 9.3 | 9.34 | 9.36 |