B. subtilis Expression Data Browser
Details about yceD Show/Hide
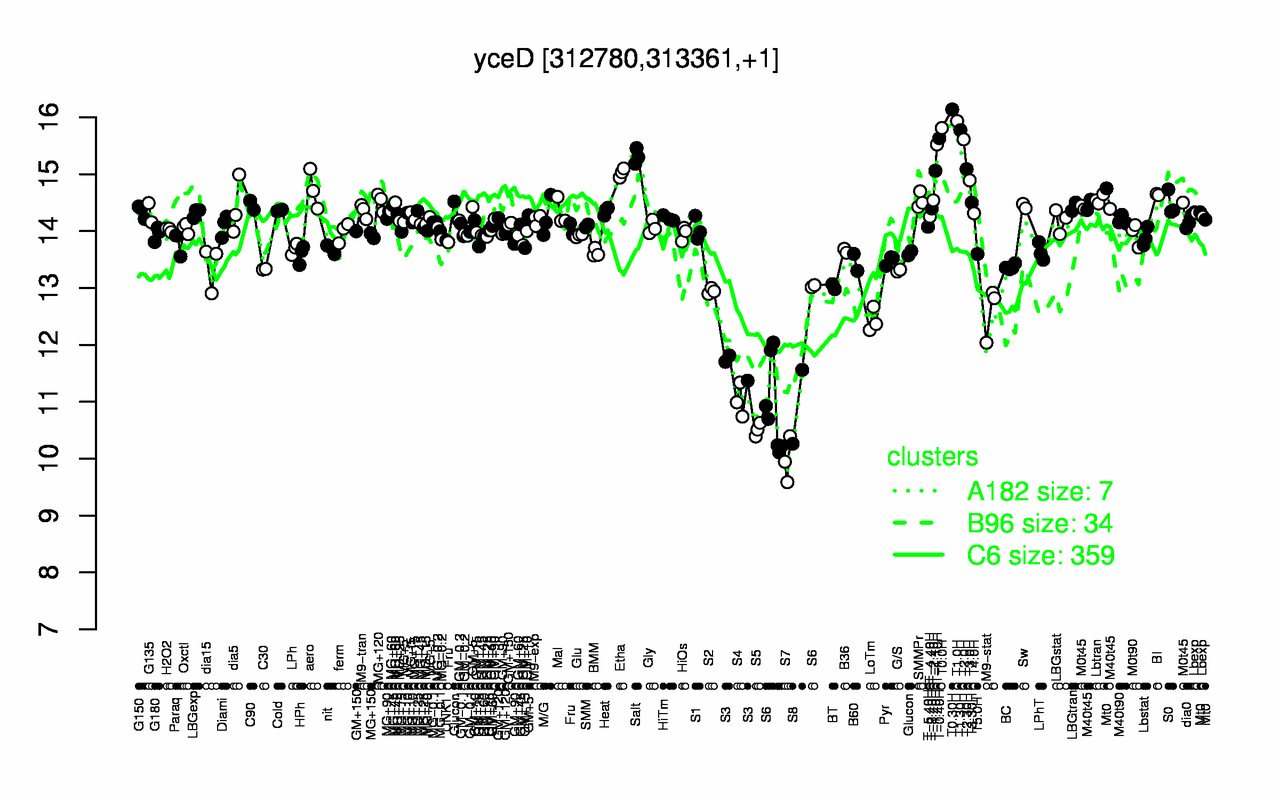
Highest Expression Conditions
T0.30H T1.0H T0.0H T1.30H T-0.40H T2.0H T-1.10H Salt T2.30H T-1.40H
16.1 15.9 15.8 15.8 15.6 15.6 15.5 15.3 15.1 15.1
Lowest Expression Conditions
S7 S5 S8 S4 S6 S3 LoTm M9-stat S2 BT
9.98 10.5 10.9 11 11.4 11.6 12.4 12.6 12.9 13
Most Positively Correlated Segments
yceE yceC yceF yceG yceH S106 addB addA ythQ dltC
0.99 0.98 0.98 0.96 0.95 0.91 0.83 0.82 0.82 0.81
Most Negatively Correlated Segments
yqhR yqhH ymaF S1506 S1505 yisN S705 S699 ynfE S533
-0.86 -0.84 -0.84 -0.84 -0.84 -0.84 -0.84 -0.84 -0.84 -0.83
Expression Profile of Segment yceD Show/Hide
Annotation of Gene yceD Show/Hide
function
16.8: Protect
inference
ab initio prediction:AMIGene:2.0
codon_start
1
product
putative stress adaptation protein
transl_table
11
note
Evidence 3: Function proposed based on presence of conserved amino acid motif, structural feature or limited homology; Product type pf: putative factor
db_xref
GI:2632576
protein_id
CAB12084.1
Genomic View of Gene/Segment yceD Show/Hide
(Legend)