| Start Page |
|
 |
| Start Page |
|
|
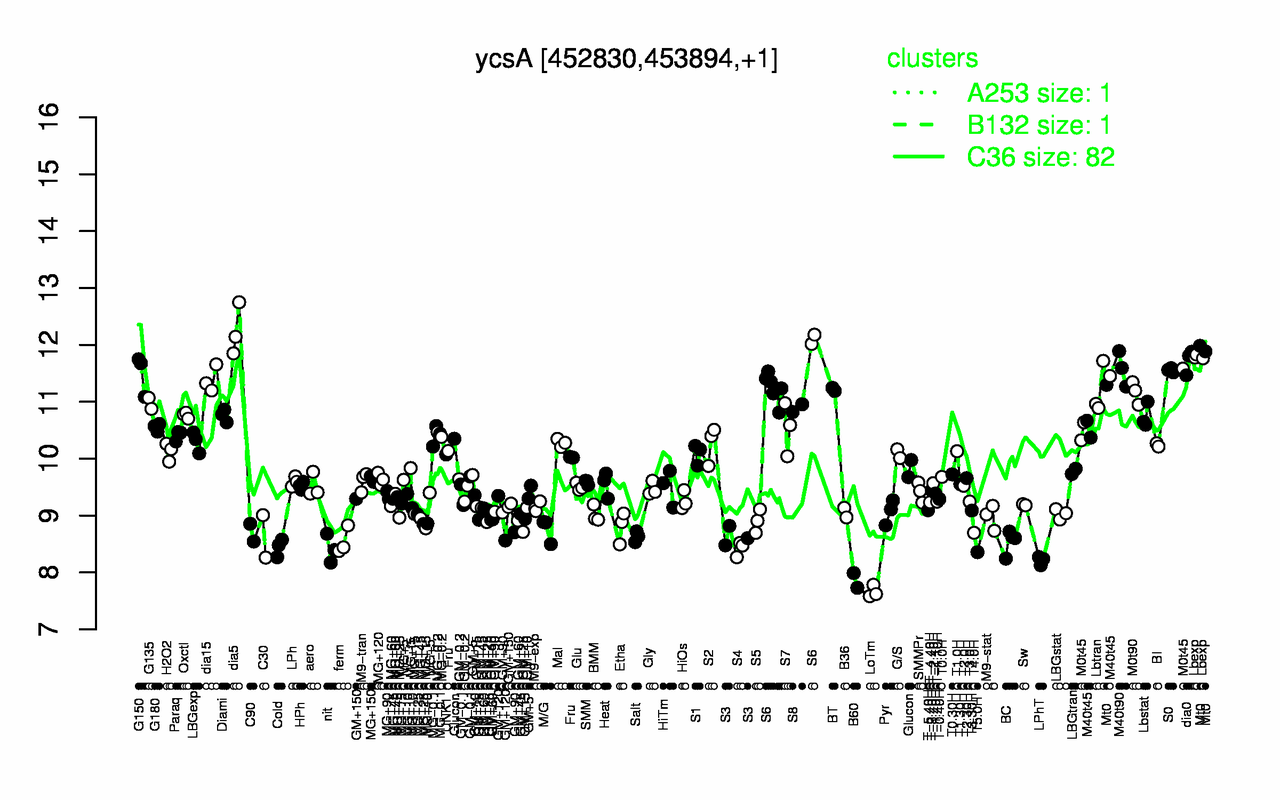
| dia5 | Lbexp | Mt0 | dia0 | M40t90 | S0 | G150 | S6 | dia15 | BT |
| 12.2 | 11.8 | 11.7 | 11.7 | 11.6 | 11.6 | 11.5 | 11.4 | 11.4 | 11.2 |
| LoTm | B60 | LPhT | T5.0H | nit | S4 | Cold | BC | ferm | Salt |
| 7.66 | 7.86 | 8.21 | 8.36 | 8.42 | 8.42 | 8.44 | 8.55 | 8.55 | 8.63 |