| Start Page |
|
 |
| Start Page |
|
|
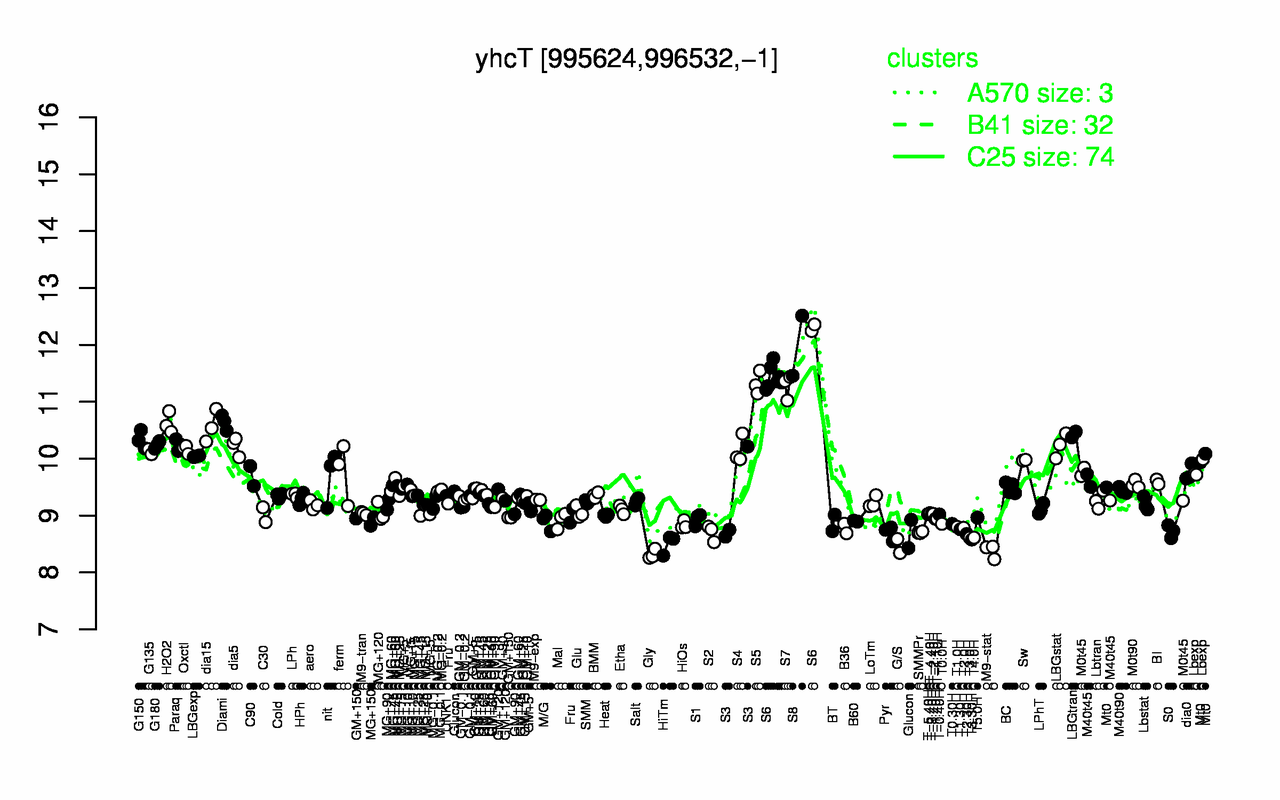
| S8 | S6 | S5 | S7 | Diami | H2O2 | dia15 | LBGtran | G150 | Paraq |
| 12 | 11.6 | 11.3 | 11.3 | 10.6 | 10.6 | 10.6 | 10.4 | 10.3 | 10.2 |
| Gly | M9-stat | G/S | HiTm | T3.30H | T4.0H | T3.0H | T2.30H | Pyr | S2 |
| 8.32 | 8.38 | 8.47 | 8.5 | 8.58 | 8.61 | 8.61 | 8.68 | 8.7 | 8.7 |