| Start Page |
|
 |
| Start Page |
|
|
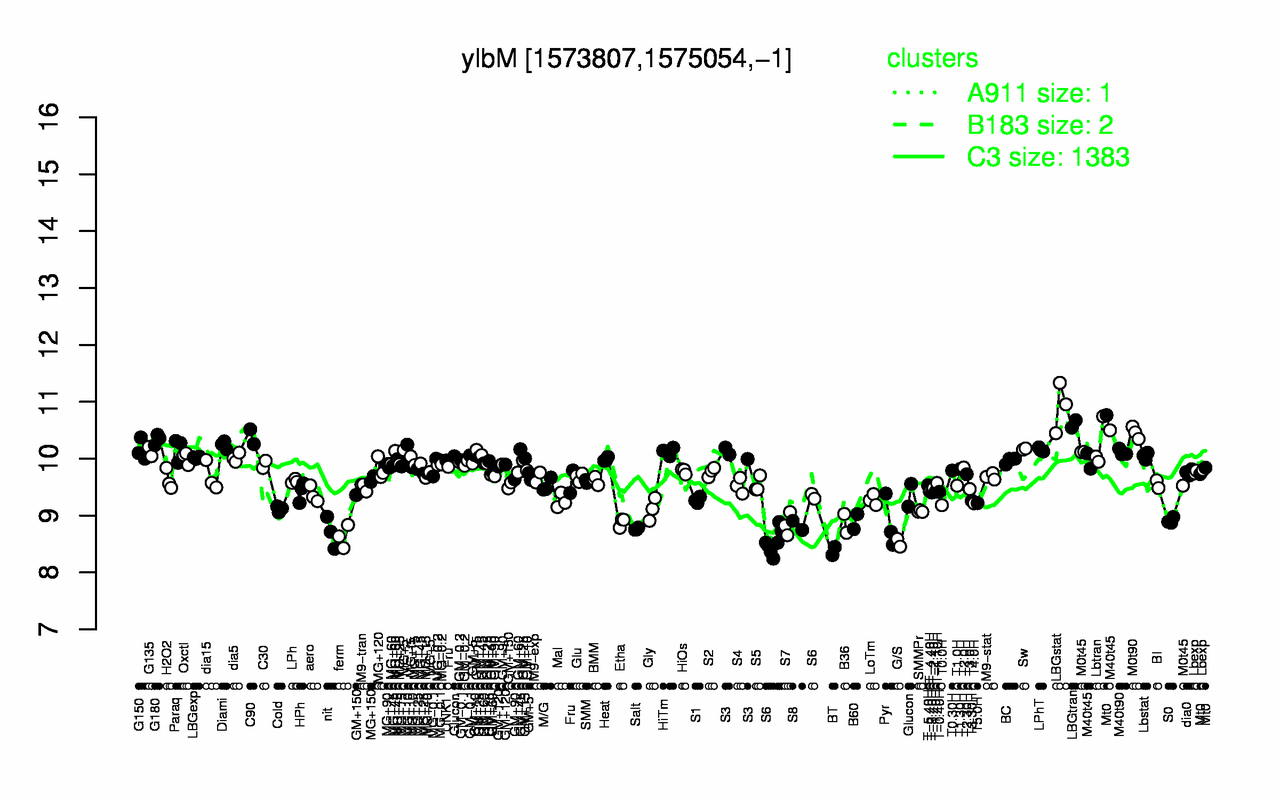
| LBGstat | LBGtran | M0t90 | C90 | G180 | Lbtran | Diami | Paraq | Sw | LPhT |
| 10.9 | 10.6 | 10.5 | 10.4 | 10.3 | 10.2 | 10.2 | 10.2 | 10.2 | 10.2 |
| BT | G/S | ferm | nit | S6 | Salt | S8 | S7 | Pyr | B36 |
| 8.38 | 8.52 | 8.63 | 8.7 | 8.71 | 8.77 | 8.83 | 8.85 | 8.86 | 8.86 |