B. subtilis Expression Data Browser
Start Page
B. subtilis Expression Data Browser
Gene/Segment:
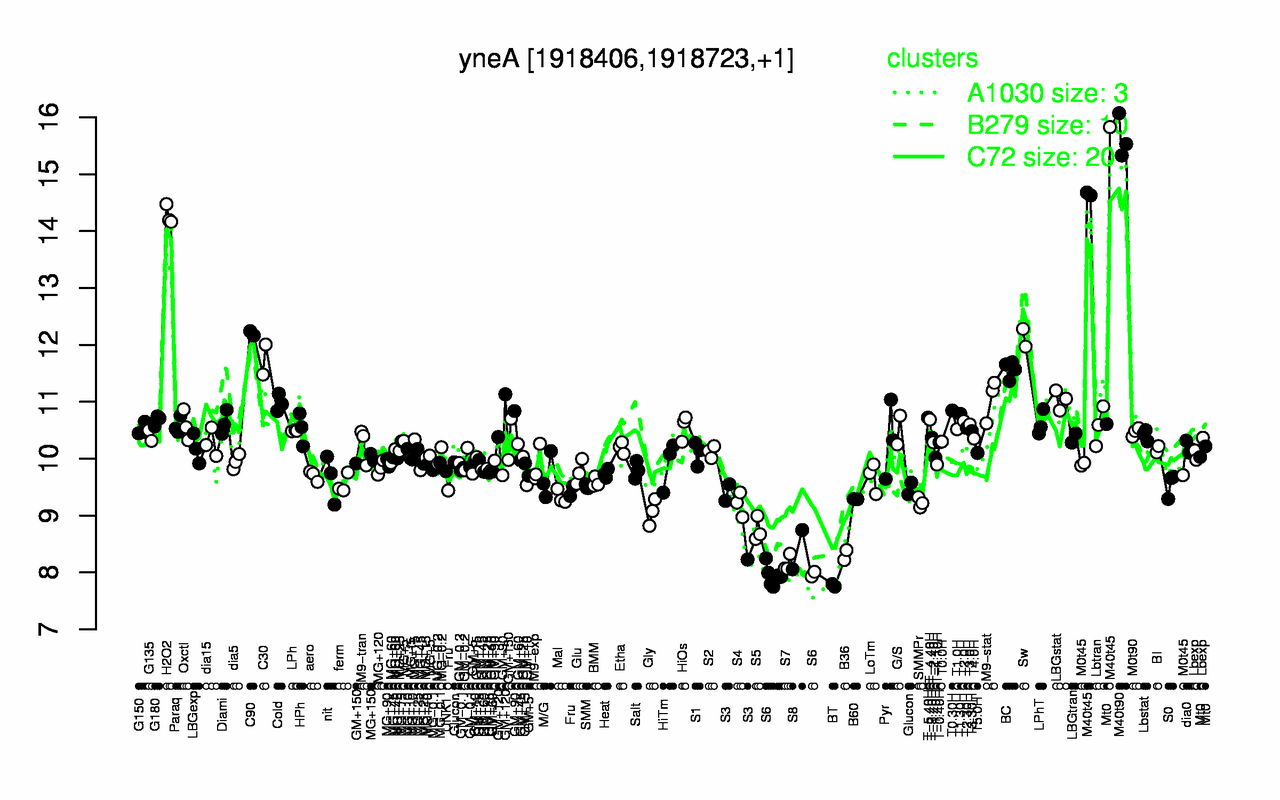
yneA
Locus Tag:
BSU17860
Details about yneA
Show/Hide
Highest Expression Conditions
M40t90
M40t45
H2O2
C90
Sw
C30
BC
M9-stat
LBGstat
Cold
15.6
15
14.3
12.2
12.1
11.7
11.6
11
11
11
Lowest Expression Conditions
BT
S6
S7
B36
S8
S5
S3
Gly
S4
SMMPr
7.77
7.95
8.15
8.31
8.4
8.75
9.01
9.06
9.2
9.23
Most Positively Correlated Segments
yneB
tagC
lexA
yorC
yhaZ
ymzE
recA
polYA
S619
uvrA
0.98
0.81
0.8
0.8
0.78
0.77
0.77
0.75
0.75
0.73
Most Negatively Correlated Segments
coxA
S1055
safA
yjnA
artP
ytzD
S1056
S909
S1451
artR
-0.61
-0.61
-0.58
-0.57
-0.56
-0.56
-0.56
-0.56
-0.56
-0.56
Expression Profile of Segment yneA
Show/Hide
Annotation of Gene yneA
Show/Hide
function
16.3: Control
inference
ab initio prediction:AMIGene:2.0
codon_start
1
product
cell division suppressor
transl_table
11
note
Evidence 1a: Function experimentally demonstrated in the studied strain; PubMedId: 12581363, 16267290, 16549676; Product type cp: cell process
db_xref
GI:2634170
protein_id
CAB13670.1
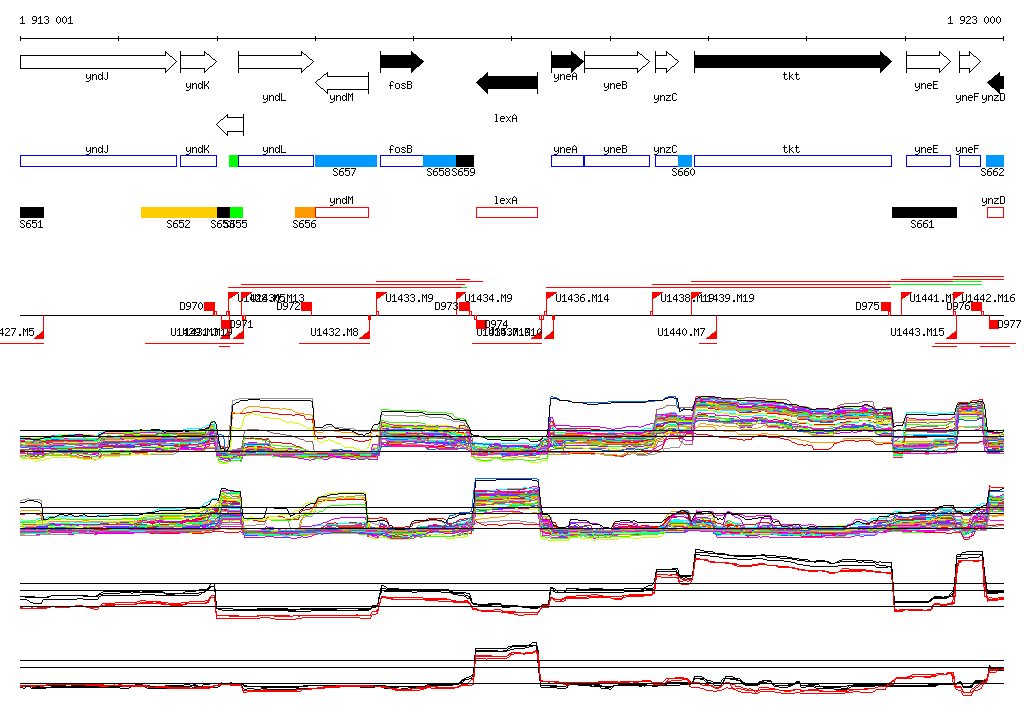
Genomic View of Gene/Segment yneA
Show/Hide
(Legend)
Browse Genome Context