| Start Page |
|
 |
| Start Page |
|
|
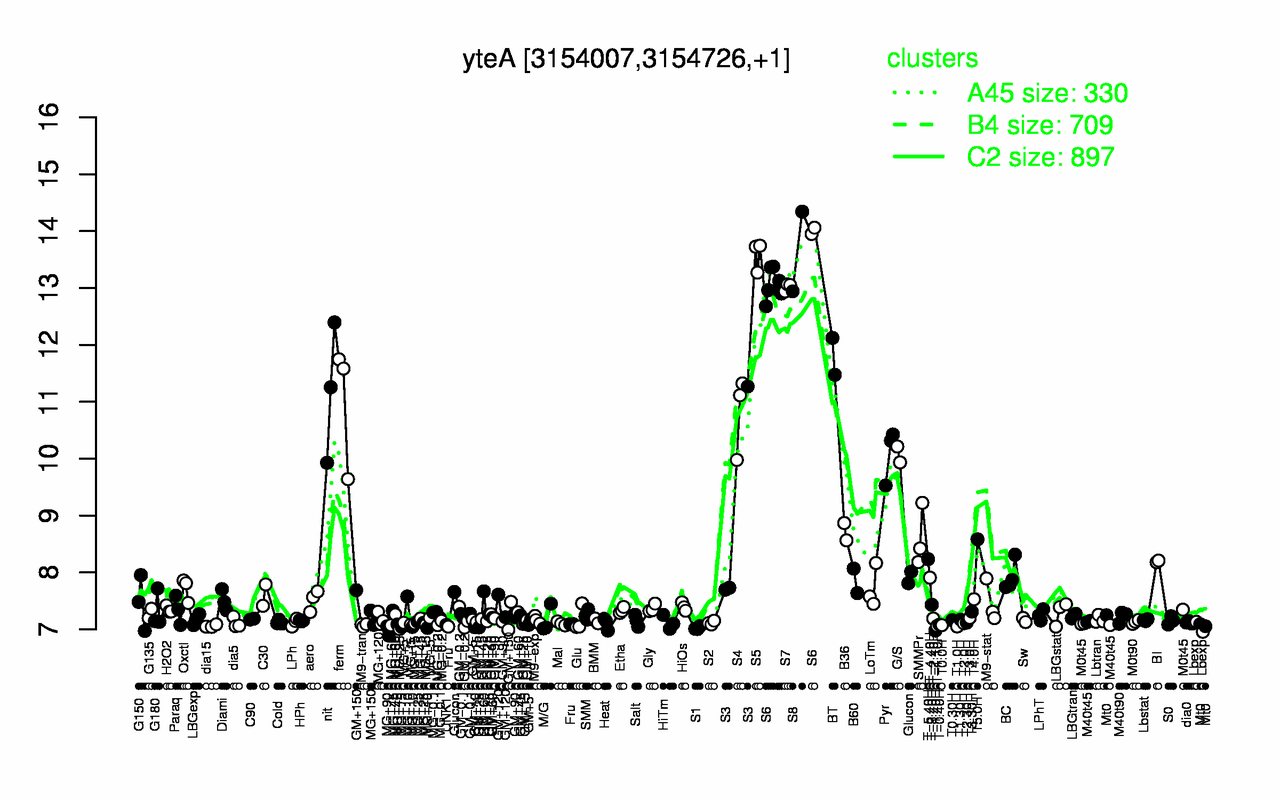
| S8 | S5 | S6 | S7 | BT | nit | ferm | S4 | Pyr | G/S |
| 13.6 | 13.6 | 13.3 | 13 | 11.8 | 11.2 | 11 | 10.8 | 10.1 | 10.1 |
| MG+90 | T-1.40H | S1 | T1.0H | dia15 | T-1.10H | Lbexp | T0.0H | M9-tran | MG+15 |
| 6.97 | 6.98 | 7.03 | 7.05 | 7.06 | 7.06 | 7.07 | 7.07 | 7.07 | 7.07 |