B. subtilis Expression Data Browser
Start Page
B. subtilis Expression Data Browser
Gene/Segment:
yttA
Locus Tag:
BSU30360
Details about yttA
Show/Hide
Highest Expression Conditions
Lbtran
M40t90
M0t90
T2.30H
MG+150
LBGtran
C90
M9-tran
MG+120
Etha
12.9
12.6
12.5
12.4
12.4
12.4
12.4
12.4
12.4
12.3
Lowest Expression Conditions
BT
S8
Sw
B36
S7
S6
Cold
LoTm
B60
BC
8.51
8.63
8.73
8.99
9.08
9.23
9.49
9.52
9.7
9.92
Most Positively Correlated Segments
S1531
yokJ
yobL
S629
yqgA
ynaE
yokI
S628
ynaF
yokK
0.82
0.79
0.78
0.78
0.77
0.77
0.76
0.75
0.75
0.75
Most Negatively Correlated Segments
S863
ymfD
yfnD
yvdP
S1206
sspF
ycgG
S1316
S1234
ywkF
-0.71
-0.71
-0.71
-0.7
-0.7
-0.69
-0.69
-0.69
-0.69
-0.69
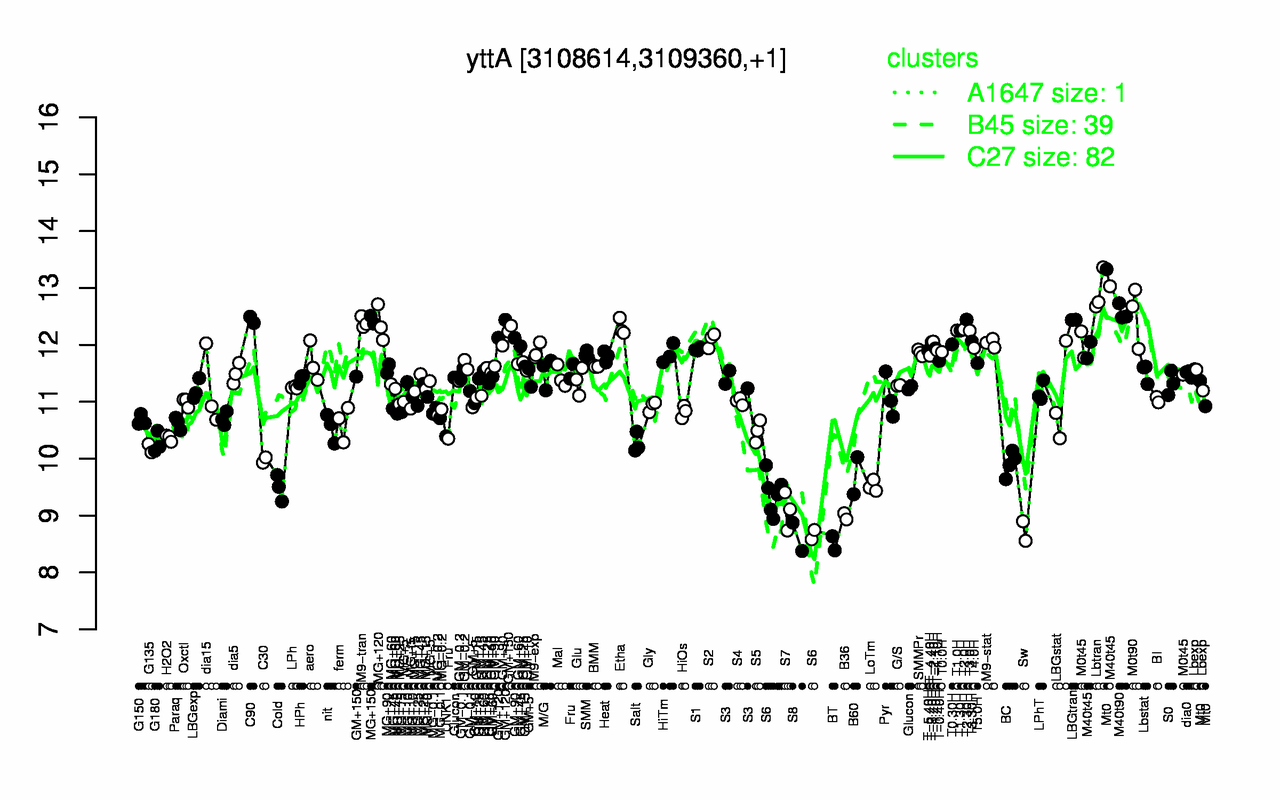
Expression Profile of Segment yttA
Show/Hide
Annotation of Gene yttA
Show/Hide
inference
ab initio prediction:AMIGene:2.0
codon_start
1
product
conserved hypothetical protein
transl_table
11
note
Evidence 4: Homologs of previously reported genes of unknown function; PubMedId: 12823818
db_xref
GI:225185325
protein_id
CAB15014.2
Genomic View of Gene/Segment yttA
Show/Hide
(Legend)
Browse Genome Context