| Supplementary data of the associated publication Start Page |
|
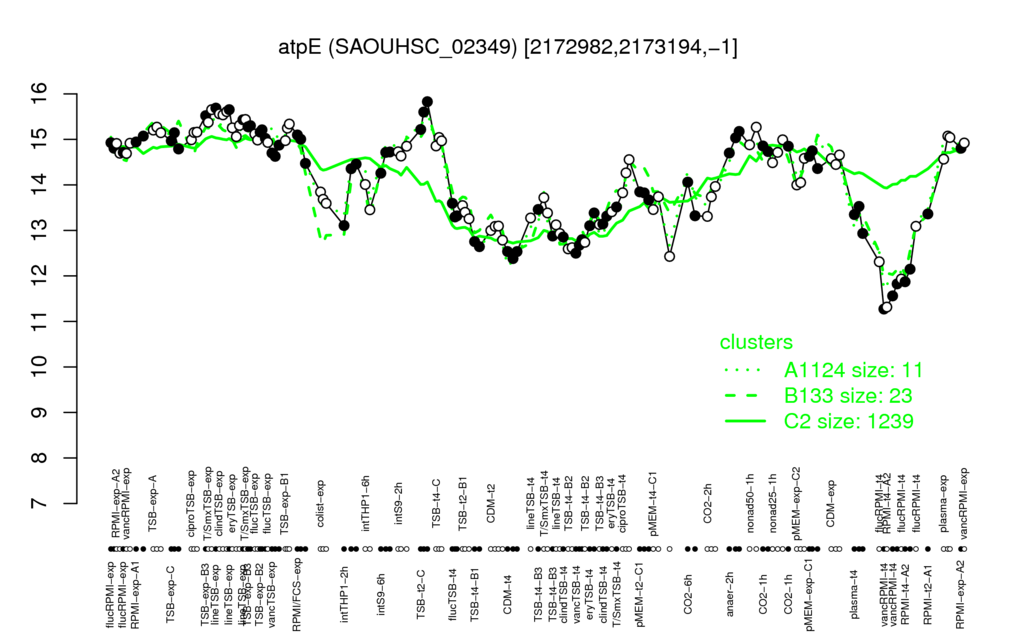
| lineTSB-exp | clindTSB-exp | TSB-t2-C | T/SmxTSB-exp | TSB-exp-B3 |
| 15.6 | 15.6 | 15.5 | 15.5 | 15.4 |
| vancRPMI-t4 | RPMI-t4-A2 | flucRPMI-t4 | CDM-t4 | TSB-t4-B2 |
| 11.6 | 11.8 | 12.4 | 12.5 | 12.7 |
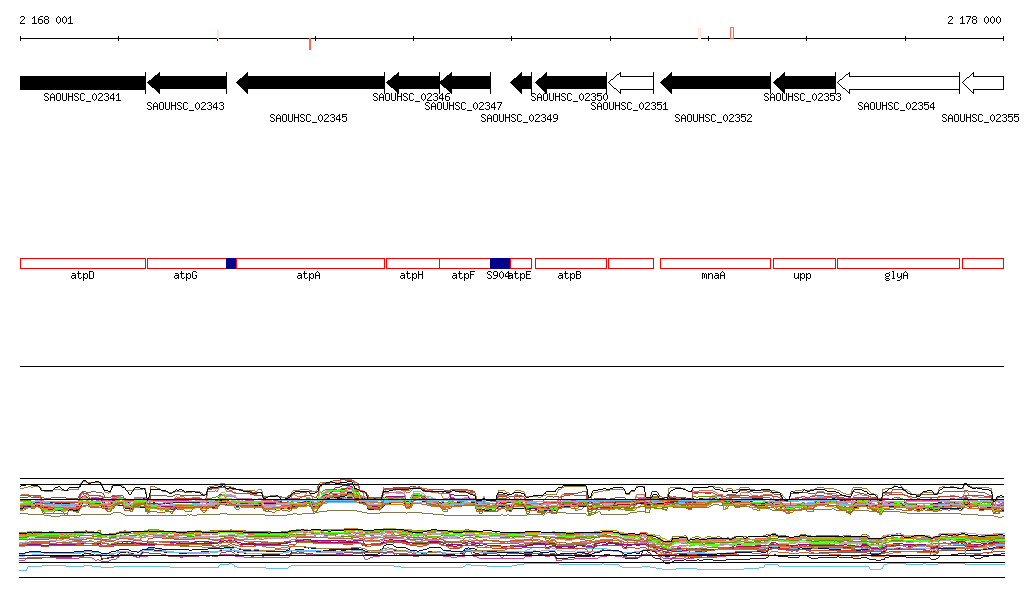
| atpB | S904 | atpF | SAOUHSC_02351 | atpD | atpG | atpA | atpH | S903 | atpC |
| 0.99 | 0.99 | 0.97 | 0.97 | 0.97 | 0.97 | 0.96 | 0.95 | 0.95 | 0.92 |
| SAOUHSC_00376 | S122 | S121 | S297 | perR | S209 | SAOUHSC_02691 | SAOUHSC_02145 | SAOUHSC_00970 | S16 |
| -0.9 | -0.9 | -0.86 | -0.85 | -0.84 | -0.84 | -0.83 | -0.83 | -0.82 | -0.82 |