S. aureus Expression Data Browser
Details about htsA
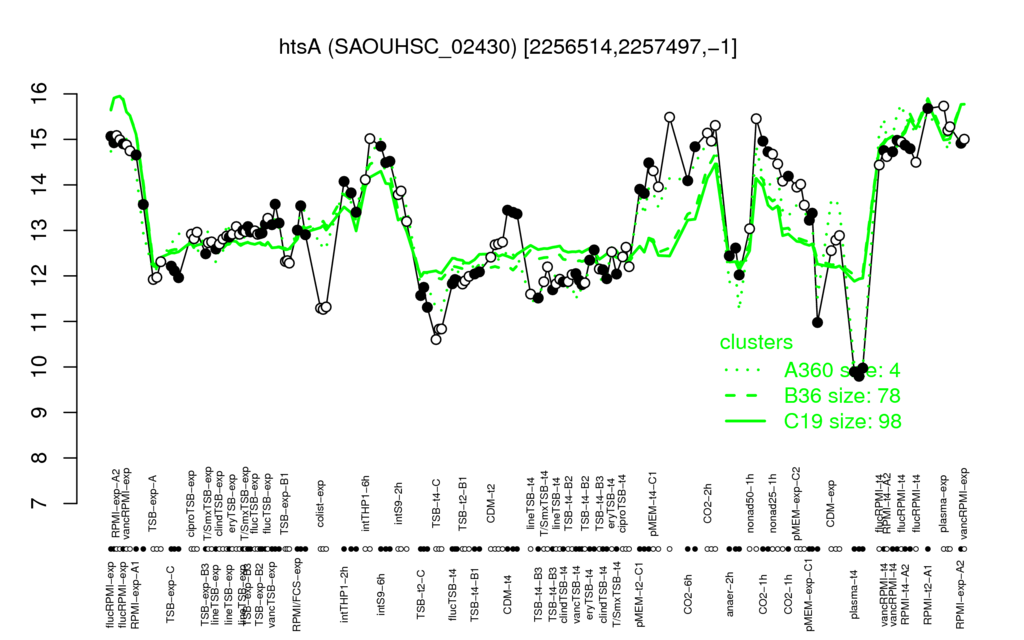
Highest Expression Conditions
RPMI-t2-A1 plasma-exp CO2-2h RPMI-exp-A2 flucRPMI-exp
15.7 15.4 15.1 15 15
Lowest Expression Conditions
plasma-t4 TSB-t4-C colist-exp TSB-t2-C lineTSB-t4
9.89 10.8 11.3 11.5 11.8
Most Positively Correlated Segments
fhuA SAOUHSC_00833 S244 isdC isdD sirA S31 htsB htsC isdE
0.88 0.83 0.83 0.82 0.82 0.81 0.8 0.8 0.8 0.79
Most Negatively Correlated Segments
S1105 SAOUHSC_02836 SAOUHSC_01907 cidB S563 ureC ureE SAOUHSC_02445 ureF SAOUHSC_01728
-0.7 -0.68 -0.67 -0.66 -0.66 -0.66 -0.66 -0.65 -0.65 -0.65
Genbank annotation of gene htsA
codon_start
1
product
ABC transporter periplasmic binding protein, putative
transl_table
11
db_xref
GI:87203643
protein_id
ABD31453.1
Additional information for gene htsA
Seed Annotation
Iron acquisition and metabolism>Iron acquisition and metabolism - no subcategory>Heme, hemin uptake and utilization systems in GramPositives>Heme ABC type transporter HtsABC, heme-binding protein
Stress Response>Stress Response - no subcategory>Flavohaemoglobin>Heme ABC type transporter HtsABC, heme-binding protein
Clusters
A360 B36 C19
Expression Profile of segment htsA
Genomic View of gene/segment htsA
(Legend) (Show/Hide rho-mutant profiles)