| Supplementary data of the associated publication Start Page |
|
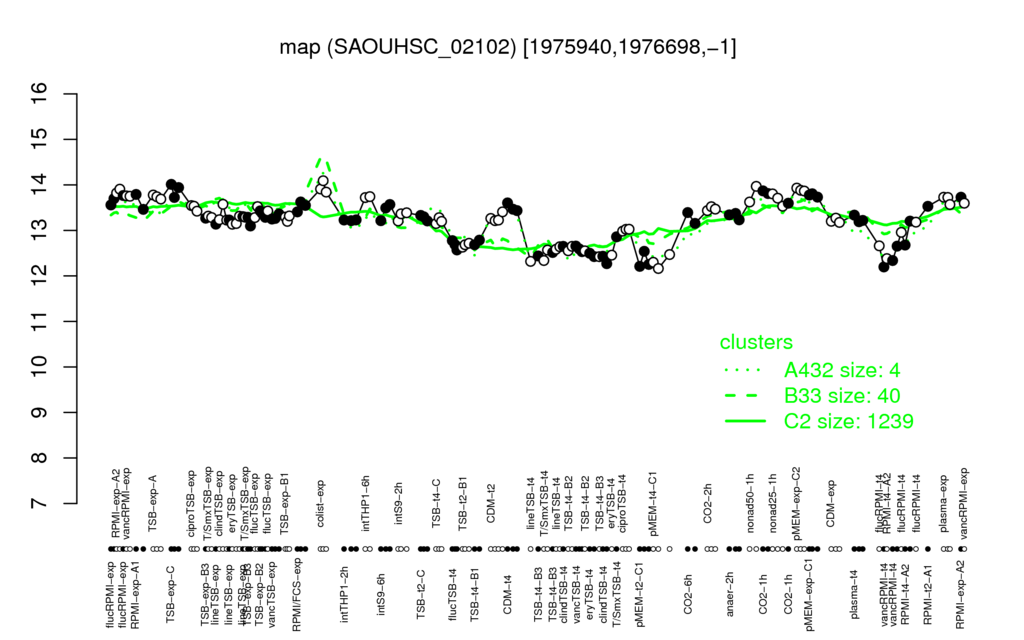
| colist-exp | TSB-exp-C | pMEM-exp-C2 | RPMI-exp-A2 | nonad50-1h |
| 13.9 | 13.9 | 13.9 | 13.8 | 13.8 |
| pMEM-t4-C1 | pMEM-t2-C1 | vancRPMI-t4 | clindTSB-t4 | TSB-t4-B3 |
| 12.3 | 12.3 | 12.4 | 12.5 | 12.5 |
| SAOUHSC_01913 | S363 | SAOUHSC_01912 | S628 | tyrS | SAOUHSC_00759 | SAOUHSC_00359 | S133 | lytH | SAOUHSC_01383 |
| 0.84 | 0.81 | 0.81 | 0.8 | 0.79 | 0.79 | 0.79 | 0.78 | 0.78 | 0.78 |
| set6 | arlR | S406 | SAOUHSC_01363 | S119 | S595 | S311 | SAOUHSC_00037 | whiA | uvrC |
| -0.79 | -0.79 | -0.78 | -0.77 | -0.77 | -0.76 | -0.76 | -0.76 | -0.75 | -0.75 |