| Supplementary data of the associated publication Start Page |
|
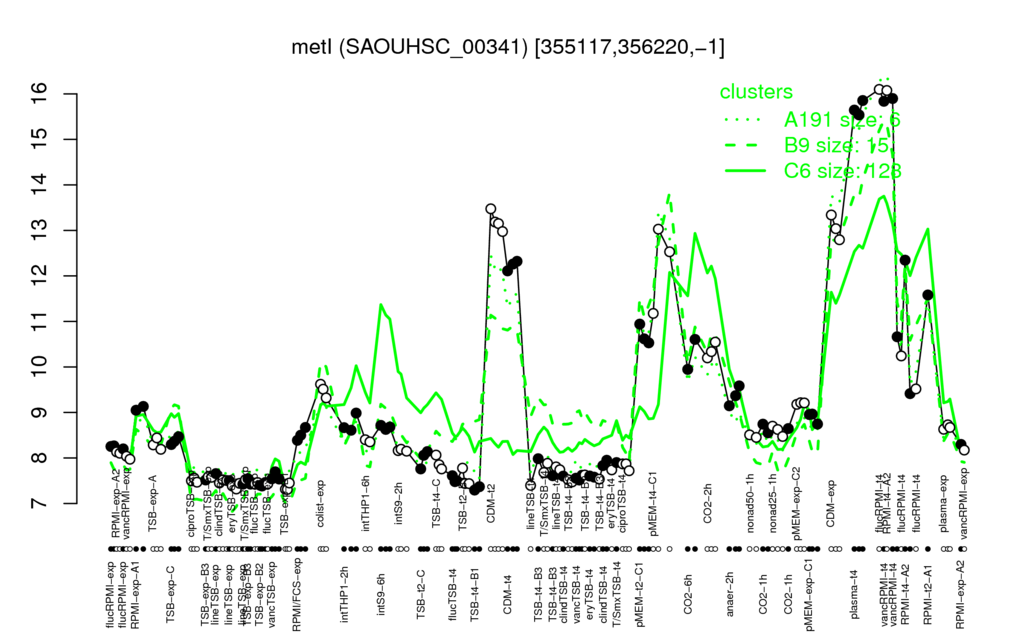
| plasma-t4 | vancRPMI-t4 | CDM-t2 | CDM-exp | RPMI-t4-A2 |
| 15.7 | 14.1 | 13.2 | 13.1 | 12.6 |
| TSB-t4-B1 | TSB-exp-B1 | eryTSB-exp | TSB-exp-B2 | flucTSB-exp |
| 7.33 | 7.36 | 7.38 | 7.41 | 7.44 |
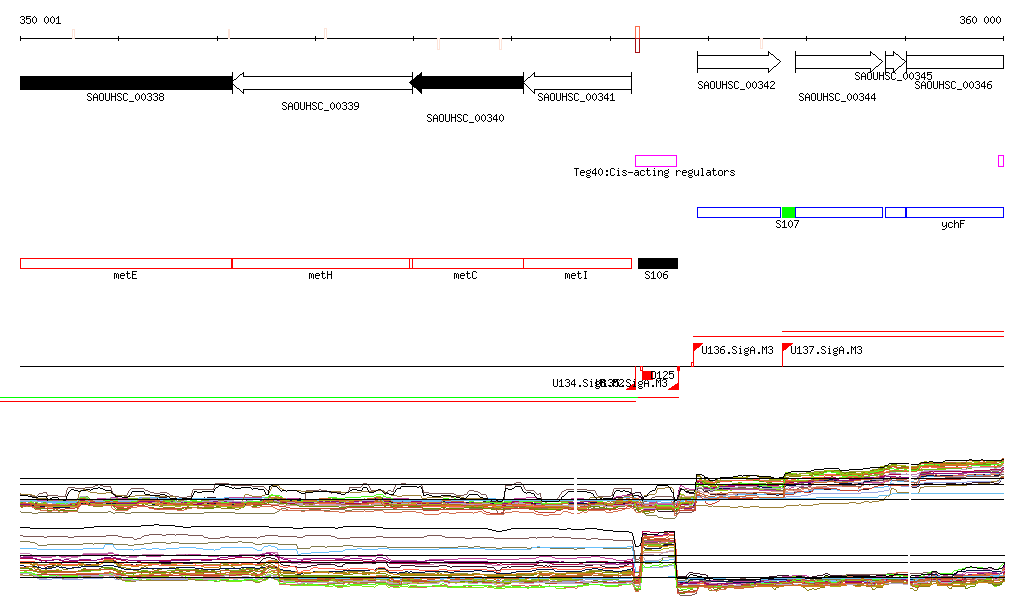
| metC | metH | metE | SAOUHSC_00337 | SAOUHSC_00842 | S350 | SAOUHSC_00844 | SAOUHSC_00843 | sdrH | SAOUHSC_00324 |
| 1 | 0.99 | 0.99 | 0.93 | 0.85 | 0.83 | 0.82 | 0.82 | 0.77 | 0.74 |
| SAOUHSC_01677 | SAOUHSC_01676 | S173 | SAOUHSC_01821 | SAOUHSC_01675 | S722 | SAOUHSC_01736 | SAOUHSC_02913 | SAOUHSC_01735 | mvaK1 |
| -0.8 | -0.75 | -0.73 | -0.7 | -0.7 | -0.7 | -0.68 | -0.67 | -0.64 | -0.63 |